

Question: 1 Examine the graph shown here Then answer the questions that follow Amount Inches of Rainfall in St Vallis 16 14 12 10 8 6
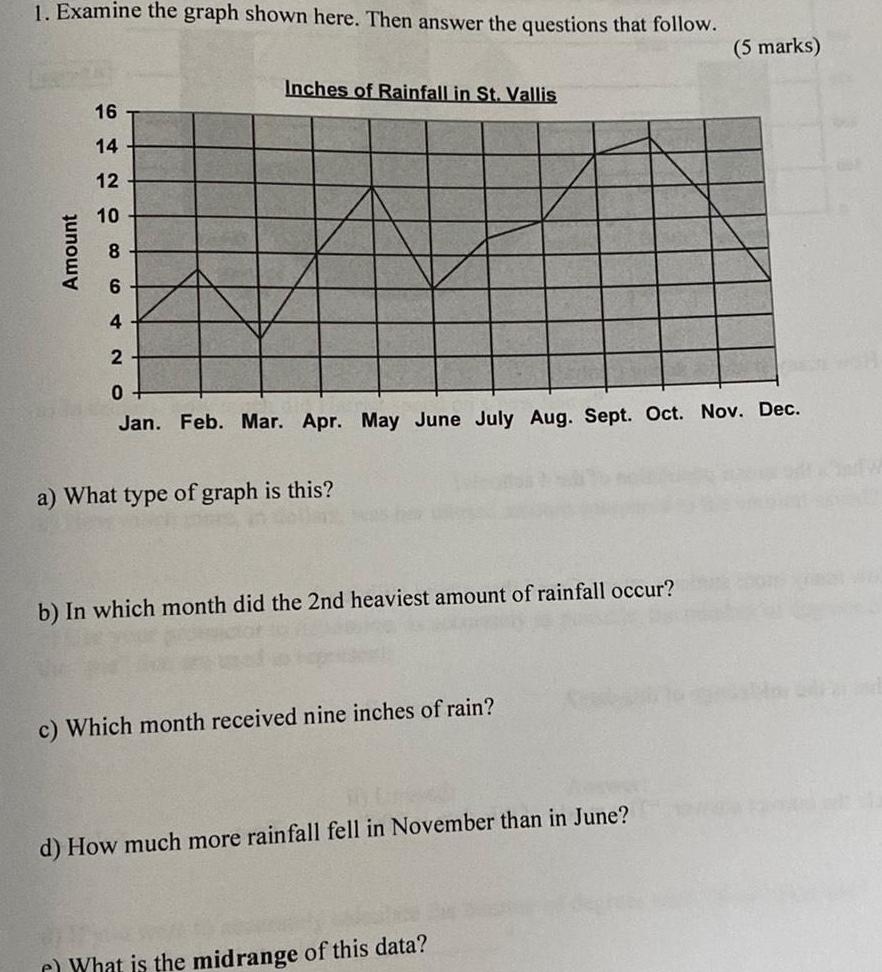

1 Examine the graph shown here Then answer the questions that follow Amount Inches of Rainfall in St Vallis 16 14 12 10 8 6 4 2 0 Jan Feb Mar Apr May June July Aug Sept Oct Nov Dec a What type of graph is this b In which month did the 2nd heaviest amount of rainfall occur c Which month received nine inches of rain d How much more rainfall fell in November than in June 5 marks r What is the midrange of this data
Step by Step Solution
There are 3 Steps involved in it
1 Expert Approved Answer
Step: 1 Unlock

Question Has Been Solved by an Expert!
Get step-by-step solutions from verified subject matter experts
Step: 2 Unlock
Step: 3 Unlock