

Question: 1 Explain how u found sales 2 Explain how u found percent of sale of op expenses (weight of each product) 3 Explain how much
- 1 Explain how u found sales
- 2 Explain how u found percent of sale of op expenses (weight of each product)
- 3 Explain how much each product produces (most to least profitable)
- 4 Explain where money is allocated (which departments)
Guidance on calculations:
- Start off with Net Product Sales of REGN Products. Your objective pertains to 2019 expenses, so you should be reviewing 2019 total revenue per product (ignore US and ROW sales). Itemize out total product revenue for Eylea, Dupixent, Praulent, and Kevzara and then divide each product's revenue by total 2019 revenue. This will give you the % portion that each product contributes to total sales. For example - Eylea contributed around 70%. Since you are only concerned with 4 out of the 8 products, you should group the combined revenue of all the remaining products into an Other and calculate the proportionate percentage of that - approximately 3%.
- Take a look at the numbers you were given in the table - Total 2019 Annual Operating Expense for each of the 5 departments. Consider what the third column "time spent supporting Commercial products" represents - 4 out of the 5 departments did not spend 100% of their time supporting Commercial products, so it wouldn't be appropriate to allocate all Operating Expense for 2019 to the four products. Instead you should adjust 2019 Operating Expense for Time Spent (so: Column 2 x Column 3) and calculate what you would call Adjusted 2019 Annual Operating Expense. This Adjusted Operating Expense is what's appropriate to allocate across all four products per your objective.
- Review the current data you have: the % share of each product's contribution to total sales revenue in 2019 and the Adjusted Operating Expense for 2019 per department. With the data we have, the best assumption we can make is that if a product is contributing more revenue to the company. If one product pulls in more revenue from sales than others, it must mean more of those products are being sold. If a certain product has more being sold, it also means the company manufactures more of those products than the ones that sold less. Manufacturing more of some products than others means they must have accrued more of the 2019 expenses.
- Considering all of that above - you should multiply the Adjusted 2019 Annual Operating Expense by the respective percentages of Eylea, Dupixent, Praluent, Kevzara, and Other. Show in a table what that allocation of expense per product looks like.
Product Sales:
| Product | 2019 Net Sales (millions) | % of Sales |
| EYLEA | ||
| Dupixent | ||
| Praluent | ||
| Kevzara | ||
| Other | ||
| Total |
Final Allocation of Adjusted Operating Expense:
| Department | Adjusted Annual Op. Expense | EYLEA | Dupixent | Praluent | Kevzara |
| Commercial | 200,000,000 | ||||
| IT | 25,000,000 | ||||
| Facilities | 0 | ||||
| Finance | 5,000,000 | ||||
| Human Resources | 7,500,000 | ||||
| Total | 237,500,000 |
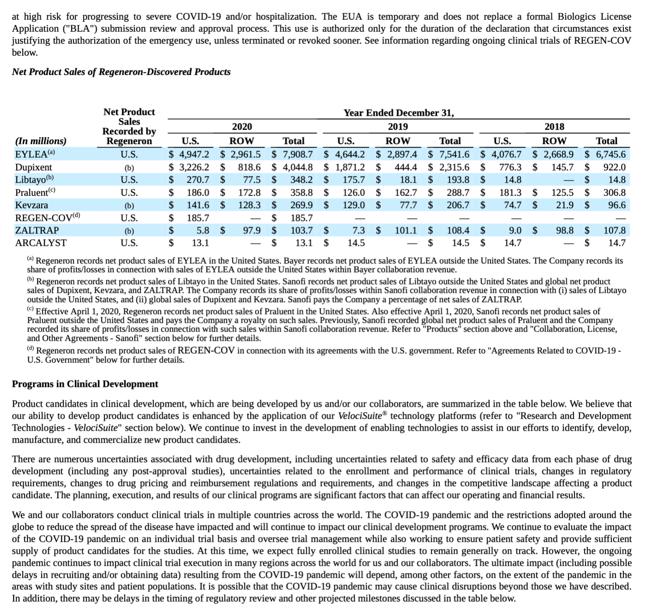
at high risk for progressing to severe COVID-19 and/or hospitalization. The EUA is temporary and does not replace a formal Biologics License Application ("BLA") submission review and approval process. This use is authorized only for the duration of the declaration that circumstances exist justifying the authorization of the emergency use, unless terminated or revoked sooner. See information regarding ongoing clinical trials of REGEN-COV below. Net Product Sales of Regeneron-Discovered Products (In millions) EYLEA Dupixent Libtayo) Praluent Kevzara REGEN-COV ZALTRAP ARCALYST Net Product Sales Recorded by Regeneron U.S. (b) U.S. U.S. (b) U.S. (b) U.S. Year Ended December 31, 2020 2019 2018 ROW U.S. ROW Total U.S. ROW Total U.S. Total $ 4,947.2 $ 2,961.5 $ 7,908.7 S 4,644.2 $2,897.4 $ 7,541.6 $4,076.7 $ 2,668.9 $6,745.6 $ 3,226.2 S 818.6 $4,044.8 $ 1,871.2 $ 444.4 $2,315.6 S 776.3 S 145.7 S 922.0 175.7 $ 126.0 $ 18.1 $ 193.8 S 162.7 $ 288.7 S 77.7 $ 206.7 S 14.8 S 14.8 181.3 S 125.5 $ 306.8 74.7 S 21.9 S 96.6 129.0 $ 77.5 S 348.2 $ 172.8 S 358.8 $ 128.3 S 269.9 $ S 185.7 103.7 S S 13.1 S $ 270.7 $ $ 186.0 $ $ 141.6 $ 185.7 5.8 $ 97.9 $ 13.1 $ $ $ 7.3 $ 14.5 101.1 $
Step by Step Solution
3.50 Rating (153 Votes )
There are 3 Steps involved in it
Here is my analysis of Regenerons 2019 financials as requested 1 I found the sales of each product b... View full answer

Get step-by-step solutions from verified subject matter experts