

Question: 1. Explain the current situation at Sun Power. What are the key points from the case as far as who, what, and how Sun Power
1. Explain the current situation at Sun Power. What are the key points from the case as far as who, what, and how Sun Power intends to do business.
2. Different parts of the value chain are explained in Table C in the case, which part of the value chain presented is really the most profitable? Explain your answer.
3. What popular movies presented solar towers as the enemies' weapon?
4. End of the case, page 18, the final paragraph, posses 4 questions, how would you answer them?
5. How is Sun Power doing today? Did they stick to plan as stated in the case? Are the top 5 competitors the same?
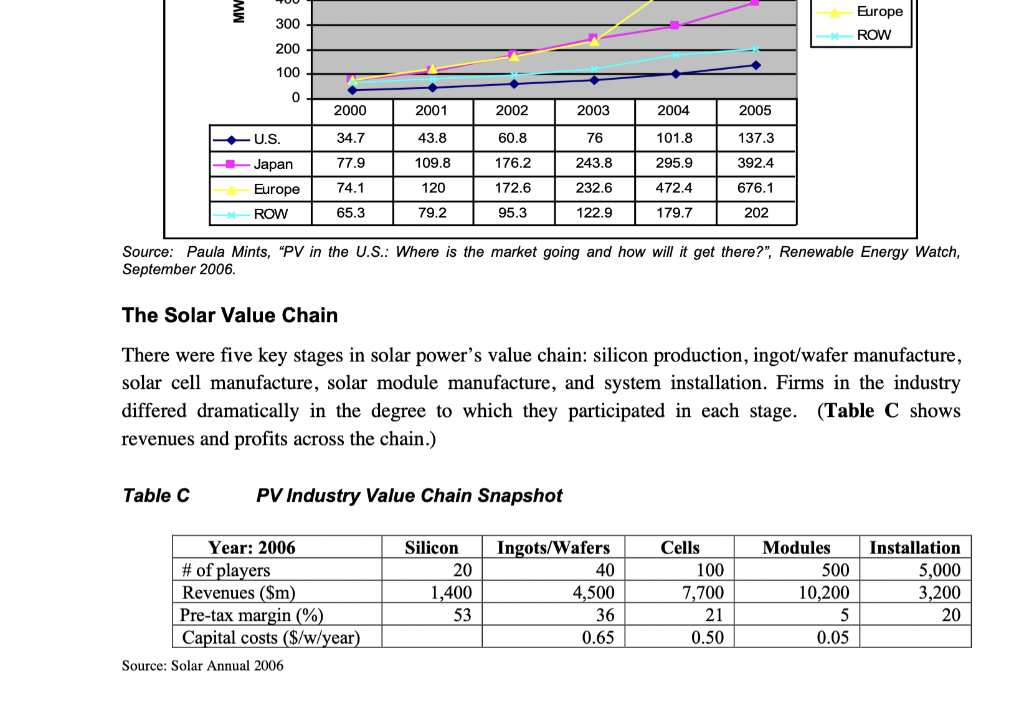
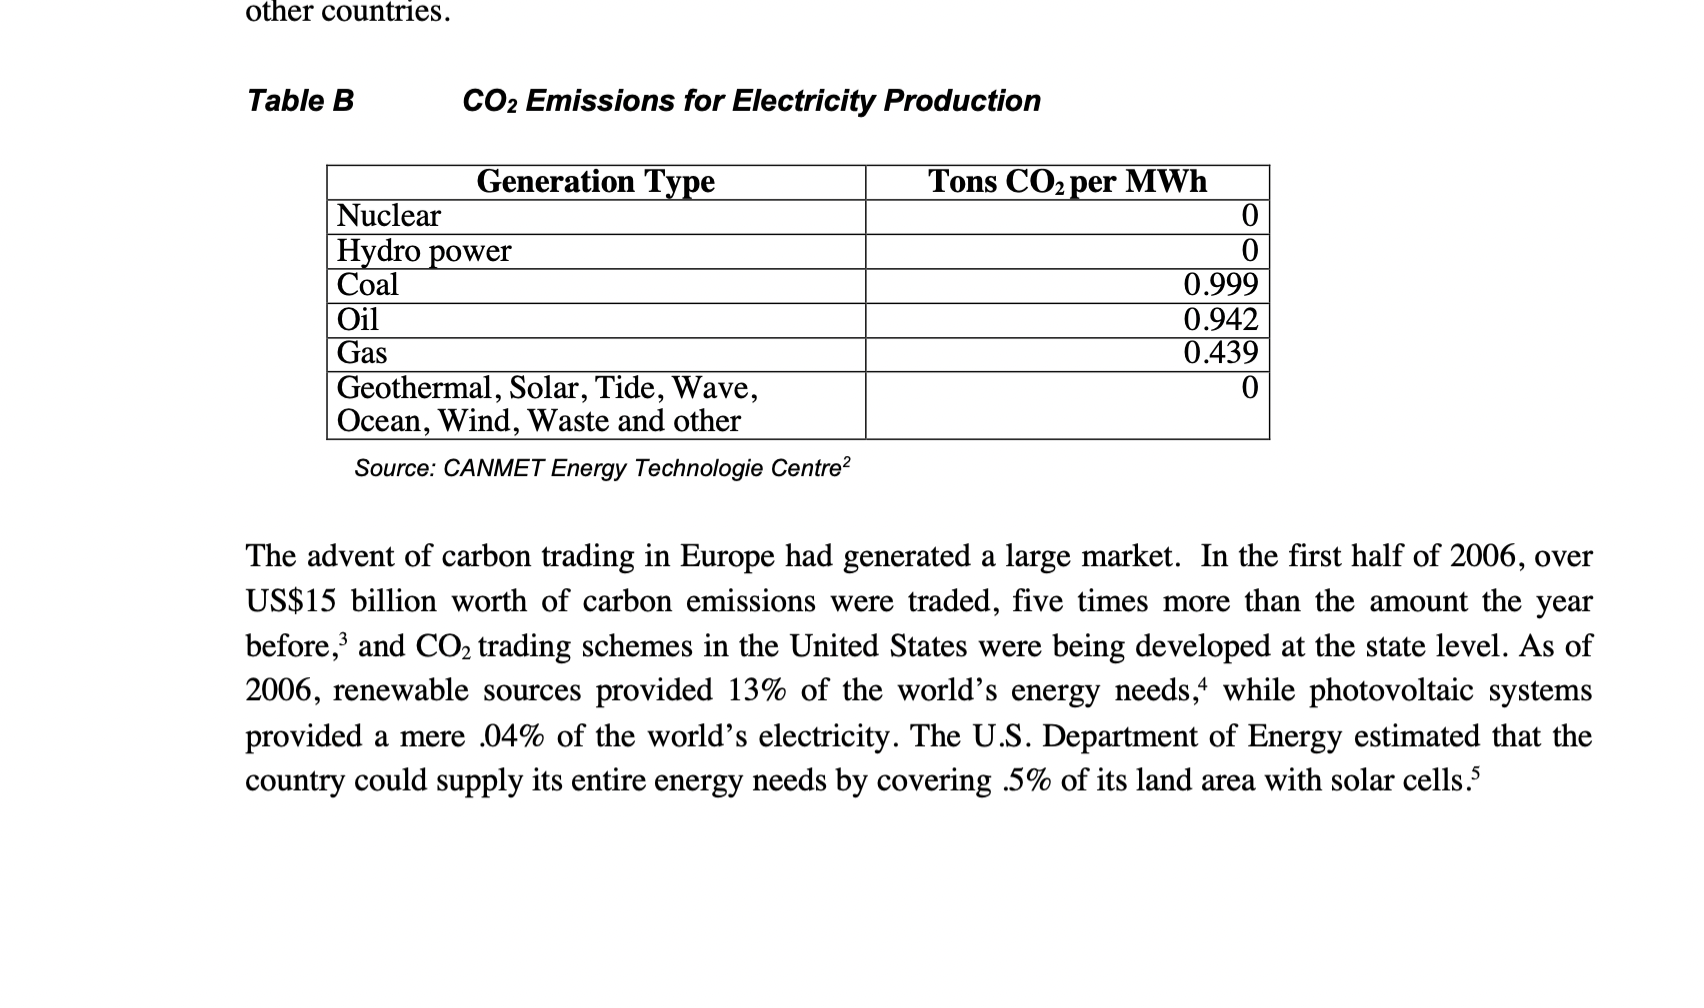
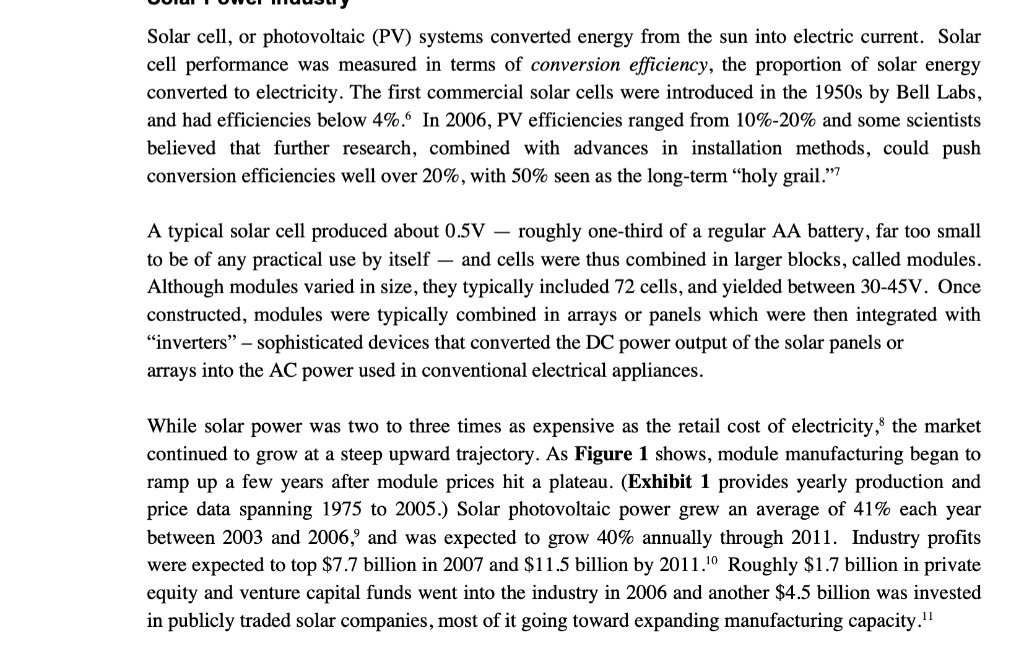
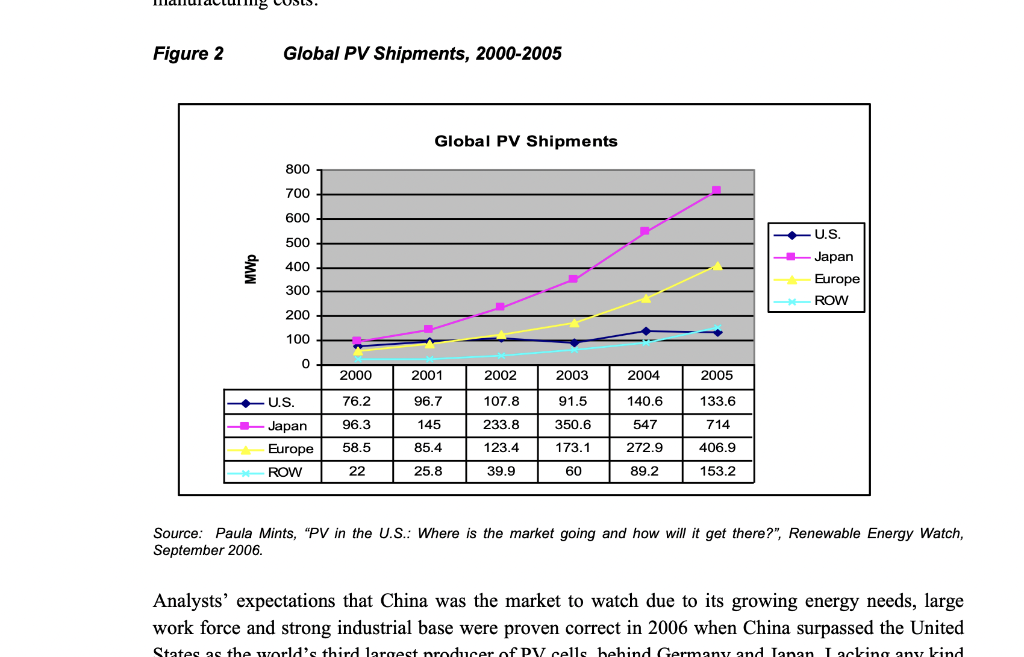
300 Europe ROW 200 100 0 2000 2001 2002 2003 2004 2005 U.S. 34.7 43.8 60.8 76 101.8 137.3 77.9 109.8 176.2 243.8 295.9 392.4 Japan Europe ROW 74.1 120 172.6 232.6 472.4 676.1 65.3 79.2 95.3 122.9 179.7 202 Source: Paula Mints, "PV in the U.S.: Where is the market going and how will it get there?", Renewable Energy Watch, September 2006. The Solar Value Chain There were five key stages in solar power's value chain: silicon production, ingot/wafer manufacture, solar cell manufacture, solar module manufacture, and system installation. Firms in the industry differed dramatically in the degree to which they participated in each stage. (Table C shows revenues and profits across the chain.) Table C PV Industry Value Chain Snapshot Silicon 20 1,400 Year: 2006 # of players Revenues ($m) Pre-tax margin (%) Capital costs ($/w/year) Source: Solar Annual 2006 Ingots/Wafers 40 4,500 36 0.65 Cells 100 7,700 21 0.50 Modules 500 10,200 5 0.05 Installation 5,000 3,200 20 It was December 2006. Tom Werner, CEO of SunPower, glanced down at his watch and shook his head in dismay. His run was not going well, despite the sounds of John Lee Hooker's Boogie Chillen coming through his earphones. He blamed the board meeting later that afternoon. Given SunPower's position as the producer of the world's most efficient solar cells, also known as photovoltaics or PV, and recent forecasts that solar power might be on the edge of explosive growth, he knew that he'd be asked some tough questions. Werner wondered how fast the solar power industry was likely to grow and how long SunPower's advantage was likely to last. How could SunPower compete with much larger companies like Sharp and Q-Cells? Or with the niche "technology play firms that were springing up? How could SunPower's current advantage be turned into an enduring competitive edge? As the sun began to rise, Werner picked up the pace again, and began jogging home. Environmental Issues One of the most important drivers of the world's renewed interest in solar power was its ability to offer energy independence in combination with significant environmental benefits. After all, the earth received more energy from the sun than humans consumed throughout an entire year. Since the burning of fossil fuels generated a number of noxious substances including SO2, NO, NO2, and particulates, concerns for human and environmental health had driven interest in solar power from its earliest days. But evidence that rising concentrations of CO2 in the earth's atmosphere could pose large long-term environmental risks had significantly increased interest in the technology. For over a century, scientists had observed the "greenhouse effect, the warming of the earth caused by the atmosphere's increased absorption of infrared radiation resulting from increased concentrations of CO2 and other greenhouse gases in the atmosphere. . Levels of CO2 had risen from around 280 parts per million volume (ppm) before the industrial revolution to 380ppmv in 2006 higher than at any point in more than half a million years. Data presented in the Intergovernmental Panel on Climate Change's (IPCC) 4th Assessment Report, a 6- year study on global warming involving 2,500 leading scientists from 100 countries, provided even more alarming statistics. For example: Greenhouse gases rose 70% between 1970 and 2004 (28.7 to 49 billion tones per year in carbon dioxide). CO2, which accounted for more than 75% of emissions, increased by 80% between 1970 and 2004. Developed countries while accounting for 20% of the global population, contributed 46% of global greenhouse gas emissions. Greenhouse gases were projected to increase between 20% and 90% by 2030 unless significant changes in global energy policies were made. . Looking longer-term, many studies suggested that increasing concentrations of green house gases greatly increased the odds of catastrophic climate change. One study published in the journal Nature predicted that temperature increases of 3.243.6F and CO2 increases to 500550 ppmv would result in the extinction of 1,000,000 terrestrial species (25% of all land animals and plants) by 2050.' Meanwhile, average global temperatures had already risen 1.33F since 1906and polar temperatures were rising faster still. other countries. Table B CO2 Emissions for Electricity Production Generation Type Nuclear Hydro power Coal Oil Gas Geothermal, Solar, Tide, Wave, Ocean, Wind, Waste and other Source: CANMET Energy Technologie Centre? Tons CO2 per MWh 0 0 0.999 0.942 0.439 0 The advent of carbon trading in Europe had generated a large market. In the first half of 2006, over US$15 billion worth of carbon emissions were traded, five times more than the amount the year before, and CO2 trading schemes in the United States were being developed at the state level. As of 2006, renewable sources provided 13% of the world's energy needs,4 while photovoltaic systems provided a mere .04% of the world's electricity. The U.S. Department of Energy estimated that the country could supply its entire energy needs by covering .5% of its land area with solar cells. Solar cell, or photovoltaic (PV) systems converted energy from the sun into electric current. Solar cell performance was measured in terms of conversion efficiency, the proportion of solar energy converted to electricity. The first commercial solar cells were introduced in the 1950s by Bell Labs, and had efficiencies below 4%. In 2006, PV efficiencies ranged from 10%-20% and some scientists believed that further research, combined with advances in installation methods, could push conversion efficiencies well over 20%, with 50% seen as the long-term "holy grail.? A typical solar cell produced about 0.5V roughly one-third of a regular AA battery, far too small to be of any practical use by itself and cells were thus combined in larger blocks, called modules. Although modules varied in size, they typically included 72 cells, and yielded between 30-45V. Once constructed, modules were typically combined in arrays or panels which were then integrated with inverters sophisticated devices that converted the DC power output of the solar panels or arrays into the AC power used in conventional electrical appliances. While solar power was two to three times as expensive as the retail cost of electricity, the market continued to grow at a steep upward trajectory. As Figure 1 shows, module manufacturing began to ramp up a few years after module prices hit a plateau. (Exhibit 1 provides yearly production and price data spanning 1975 to 2005.) Solar photovoltaic power grew an average of 41% each year between 2003 and 2006, and was expected to grow 40% annually through 2011. Industry profits were expected to top $7.7 billion in 2007 and $11.5 billion by 2011.10 Roughly $1.7 billion in private equity and venture capital funds went into the industry in 2006 and another $4.5 billion was invested in publicly traded solar companies, most of it going toward expanding manufacturing capacity." Figure 2 Global PV Shipments, 2000-2005 Global PV Shipments 800 700 600 500 MWp 400 U.S. Japan Europe ROW 300 200 100 0 2000 2001 2002 2003 2004 2005 U.S. 76.2 96.7 107.8 91.5 140.6 133.6 96.3 233.8 350.6 547 714 Japan Europe ROW 145 85.4 58.5 123.4 173.1 406.9 272.9 89.2 22 25.8 39.9 60 153.2 Source: Paula Mints, "PV in the U.S.: Where is the market going and how will it get there?", Renewable Energy Watch, September 2006. Analysts' expectations that China was the market to watch due to its growing energy needs, large work force and strong industrial base were proven correct in 2006 when China surpassed the United States as the world's third largest producer of PV cells behind Germany and Lanan Lacking any kind 300 Europe ROW 200 100 0 2000 2001 2002 2003 2004 2005 U.S. 34.7 43.8 60.8 76 101.8 137.3 77.9 109.8 176.2 243.8 295.9 392.4 Japan Europe ROW 74.1 120 172.6 232.6 472.4 676.1 65.3 79.2 95.3 122.9 179.7 202 Source: Paula Mints, "PV in the U.S.: Where is the market going and how will it get there?", Renewable Energy Watch, September 2006. The Solar Value Chain There were five key stages in solar power's value chain: silicon production, ingot/wafer manufacture, solar cell manufacture, solar module manufacture, and system installation. Firms in the industry differed dramatically in the degree to which they participated in each stage. (Table C shows revenues and profits across the chain.) Table C PV Industry Value Chain Snapshot Silicon 20 1,400 Year: 2006 # of players Revenues ($m) Pre-tax margin (%) Capital costs ($/w/year) Source: Solar Annual 2006 Ingots/Wafers 40 4,500 36 0.65 Cells 100 7,700 21 0.50 Modules 500 10,200 5 0.05 Installation 5,000 3,200 20 It was December 2006. Tom Werner, CEO of SunPower, glanced down at his watch and shook his head in dismay. His run was not going well, despite the sounds of John Lee Hooker's Boogie Chillen coming through his earphones. He blamed the board meeting later that afternoon. Given SunPower's position as the producer of the world's most efficient solar cells, also known as photovoltaics or PV, and recent forecasts that solar power might be on the edge of explosive growth, he knew that he'd be asked some tough questions. Werner wondered how fast the solar power industry was likely to grow and how long SunPower's advantage was likely to last. How could SunPower compete with much larger companies like Sharp and Q-Cells? Or with the niche "technology play firms that were springing up? How could SunPower's current advantage be turned into an enduring competitive edge? As the sun began to rise, Werner picked up the pace again, and began jogging home. Environmental Issues One of the most important drivers of the world's renewed interest in solar power was its ability to offer energy independence in combination with significant environmental benefits. After all, the earth received more energy from the sun than humans consumed throughout an entire year. Since the burning of fossil fuels generated a number of noxious substances including SO2, NO, NO2, and particulates, concerns for human and environmental health had driven interest in solar power from its earliest days. But evidence that rising concentrations of CO2 in the earth's atmosphere could pose large long-term environmental risks had significantly increased interest in the technology. For over a century, scientists had observed the "greenhouse effect, the warming of the earth caused by the atmosphere's increased absorption of infrared radiation resulting from increased concentrations of CO2 and other greenhouse gases in the atmosphere. . Levels of CO2 had risen from around 280 parts per million volume (ppm) before the industrial revolution to 380ppmv in 2006 higher than at any point in more than half a million years. Data presented in the Intergovernmental Panel on Climate Change's (IPCC) 4th Assessment Report, a 6- year study on global warming involving 2,500 leading scientists from 100 countries, provided even more alarming statistics. For example: Greenhouse gases rose 70% between 1970 and 2004 (28.7 to 49 billion tones per year in carbon dioxide). CO2, which accounted for more than 75% of emissions, increased by 80% between 1970 and 2004. Developed countries while accounting for 20% of the global population, contributed 46% of global greenhouse gas emissions. Greenhouse gases were projected to increase between 20% and 90% by 2030 unless significant changes in global energy policies were made. . Looking longer-term, many studies suggested that increasing concentrations of green house gases greatly increased the odds of catastrophic climate change. One study published in the journal Nature predicted that temperature increases of 3.243.6F and CO2 increases to 500550 ppmv would result in the extinction of 1,000,000 terrestrial species (25% of all land animals and plants) by 2050.' Meanwhile, average global temperatures had already risen 1.33F since 1906and polar temperatures were rising faster still. other countries. Table B CO2 Emissions for Electricity Production Generation Type Nuclear Hydro power Coal Oil Gas Geothermal, Solar, Tide, Wave, Ocean, Wind, Waste and other Source: CANMET Energy Technologie Centre? Tons CO2 per MWh 0 0 0.999 0.942 0.439 0 The advent of carbon trading in Europe had generated a large market. In the first half of 2006, over US$15 billion worth of carbon emissions were traded, five times more than the amount the year before, and CO2 trading schemes in the United States were being developed at the state level. As of 2006, renewable sources provided 13% of the world's energy needs,4 while photovoltaic systems provided a mere .04% of the world's electricity. The U.S. Department of Energy estimated that the country could supply its entire energy needs by covering .5% of its land area with solar cells. Solar cell, or photovoltaic (PV) systems converted energy from the sun into electric current. Solar cell performance was measured in terms of conversion efficiency, the proportion of solar energy converted to electricity. The first commercial solar cells were introduced in the 1950s by Bell Labs, and had efficiencies below 4%. In 2006, PV efficiencies ranged from 10%-20% and some scientists believed that further research, combined with advances in installation methods, could push conversion efficiencies well over 20%, with 50% seen as the long-term "holy grail.? A typical solar cell produced about 0.5V roughly one-third of a regular AA battery, far too small to be of any practical use by itself and cells were thus combined in larger blocks, called modules. Although modules varied in size, they typically included 72 cells, and yielded between 30-45V. Once constructed, modules were typically combined in arrays or panels which were then integrated with inverters sophisticated devices that converted the DC power output of the solar panels or arrays into the AC power used in conventional electrical appliances. While solar power was two to three times as expensive as the retail cost of electricity, the market continued to grow at a steep upward trajectory. As Figure 1 shows, module manufacturing began to ramp up a few years after module prices hit a plateau. (Exhibit 1 provides yearly production and price data spanning 1975 to 2005.) Solar photovoltaic power grew an average of 41% each year between 2003 and 2006, and was expected to grow 40% annually through 2011. Industry profits were expected to top $7.7 billion in 2007 and $11.5 billion by 2011.10 Roughly $1.7 billion in private equity and venture capital funds went into the industry in 2006 and another $4.5 billion was invested in publicly traded solar companies, most of it going toward expanding manufacturing capacity." Figure 2 Global PV Shipments, 2000-2005 Global PV Shipments 800 700 600 500 MWp 400 U.S. Japan Europe ROW 300 200 100 0 2000 2001 2002 2003 2004 2005 U.S. 76.2 96.7 107.8 91.5 140.6 133.6 96.3 233.8 350.6 547 714 Japan Europe ROW 145 85.4 58.5 123.4 173.1 406.9 272.9 89.2 22 25.8 39.9 60 153.2 Source: Paula Mints, "PV in the U.S.: Where is the market going and how will it get there?", Renewable Energy Watch, September 2006. Analysts' expectations that China was the market to watch due to its growing energy needs, large work force and strong industrial base were proven correct in 2006 when China surpassed the United States as the world's third largest producer of PV cells behind Germany and Lanan Lacking any kind
Step by Step Solution
There are 3 Steps involved in it

Get step-by-step solutions from verified subject matter experts