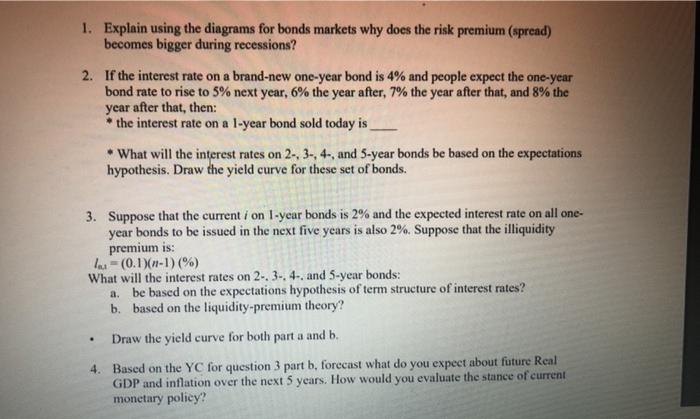
Question: 1. Explain using the diagrams for bonds markets why does the risk premium (spread) becomes bigger during recessions? 2. If the interest rate on a

1. Explain using the diagrams for bonds markets
1. Explain using the diagrams for bonds markets why does the risk premium (spread) becomes bigger during recessions? 2. If the interest rate on a brand-new one-year bond is 4% and people expect the one-year bond rate to rise to 5% next year, 6% the year after, 7% the year after that, and 8% the year after that, then: the interest rate on a 1-year bond sold today is What will the interest rates on 2-, 3-, 4-, and 5-year bonds be based on the expectations hypothesis. Draw the yield curve for these set of bonds. 3. Suppose that the current i on 1-year bonds is 2% and the expected interest rate on all one- year bonds to be issued in the next five years is also 2%. Suppose that the illiquidity premium is: 1-(0.1)(n-1) (%) What will the interest rates on 2-, 3-, 4-. and 5-year bonds: a. be based on the expectations hypothesis of term structure of interest rates? b. based on the liquidity-premium theory? Draw the yield curve for both part a and b. 4. Based on the YC for question 3 part b, forecast what do you expect about future Real GDP and inflation over the next 5 years. How would you evaluate the stance of current monetary policy

Step by Step Solution

There are 3 Steps involved in it

1 Expert Approved Answer
Step: 1 Unlock blur-text-image
Question Has Been Solved by an Expert!

Get step-by-step solutions from verified subject matter experts

Step: 2 Unlock
Step: 3 Unlock

Students Have Also Explored These Related General Management Questions!