

Question: 1. explain whether average medical payments are normally distributed. Discuss the test result and each figure in your paragraph 2. Write brief summary explaining whether
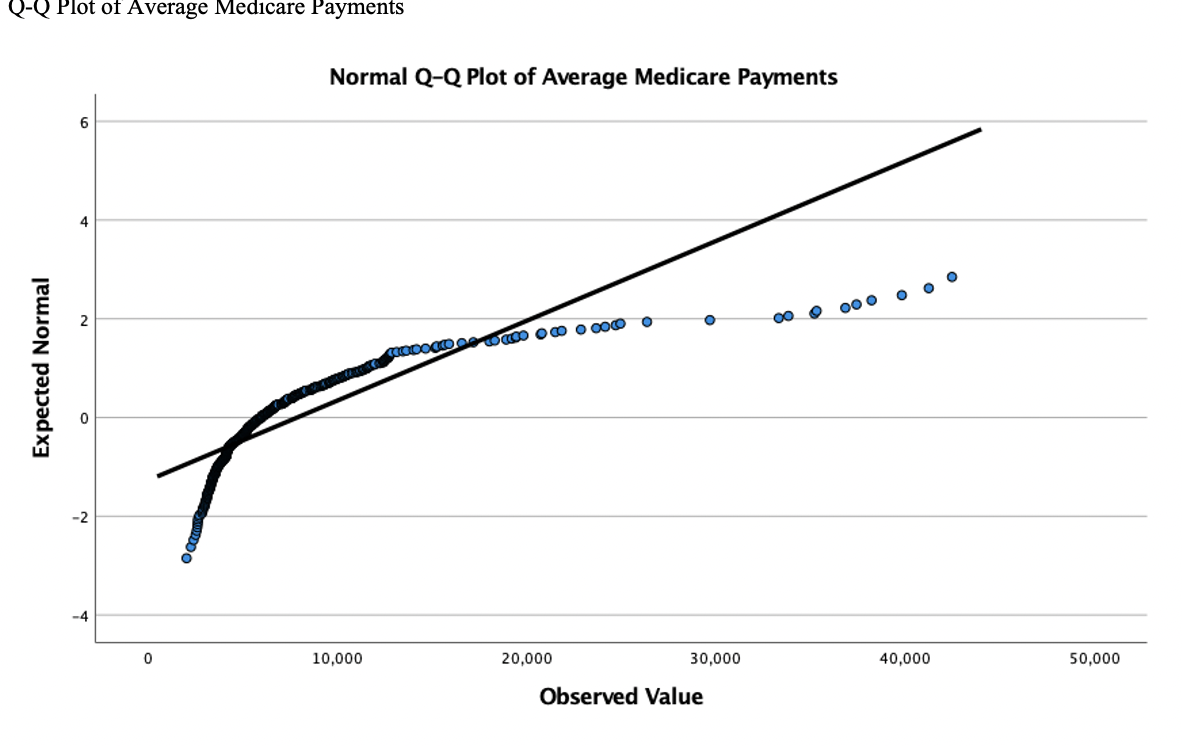
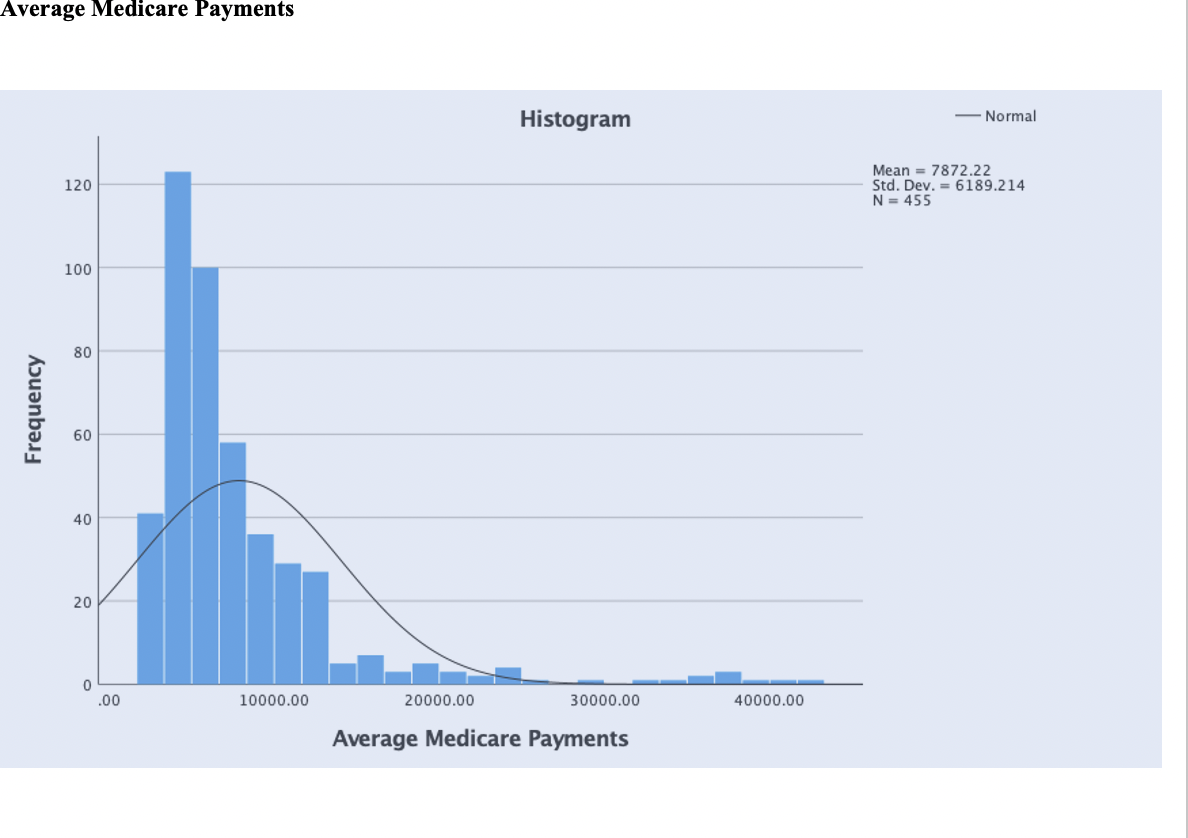
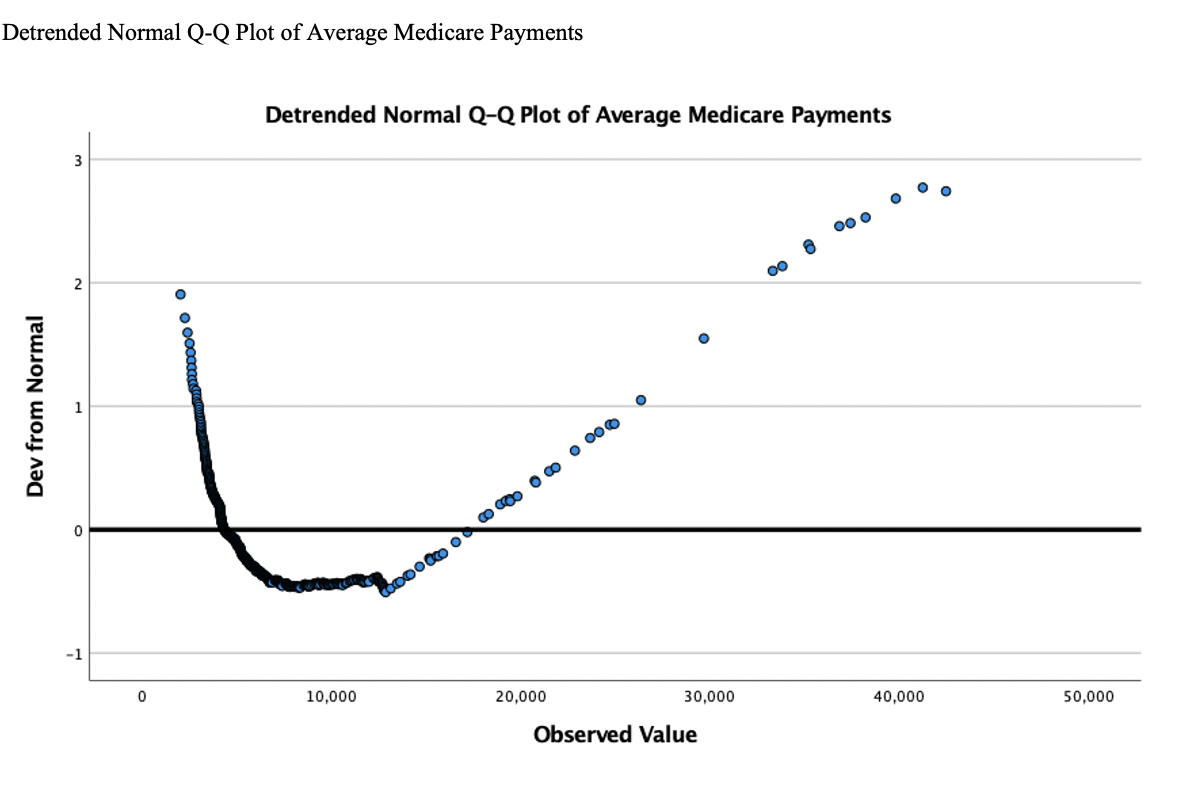
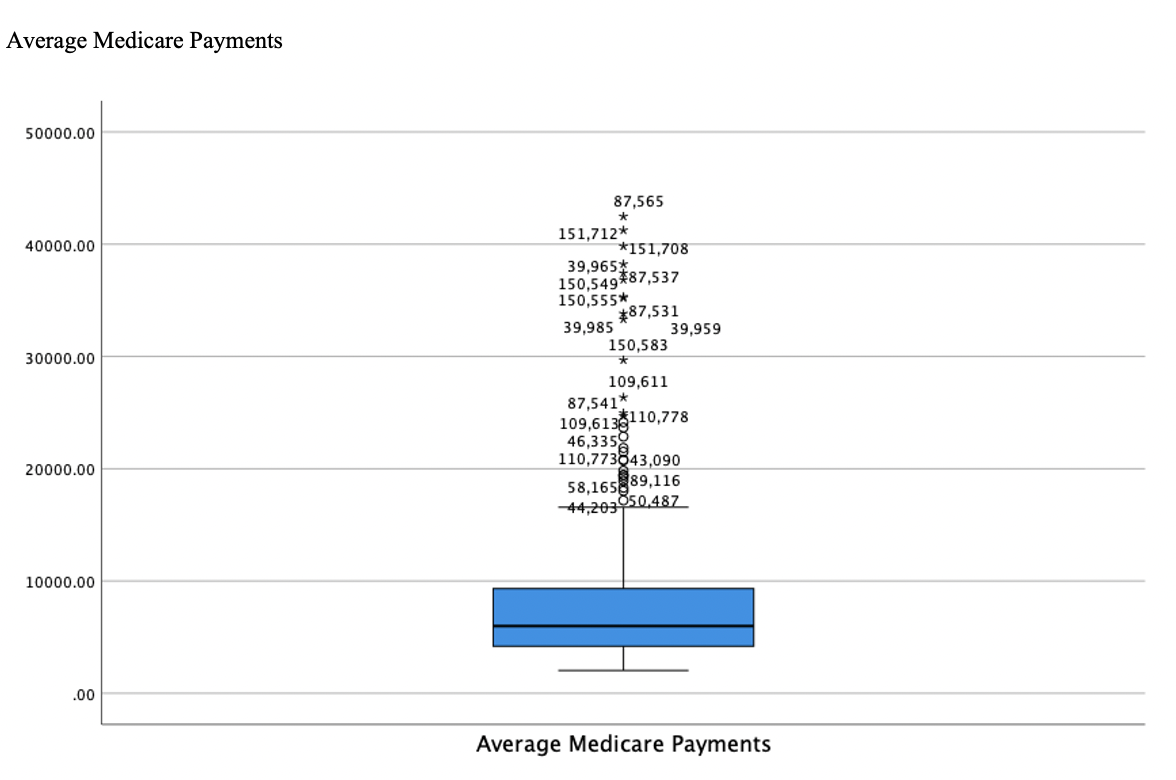
1. explain whether average medical payments are normally distributed. Discuss the test result and each figure in your paragraph
2. Write brief summary explaining whether the variable LNTemp is normally distributed (in other words, discuss whether the transformation worked)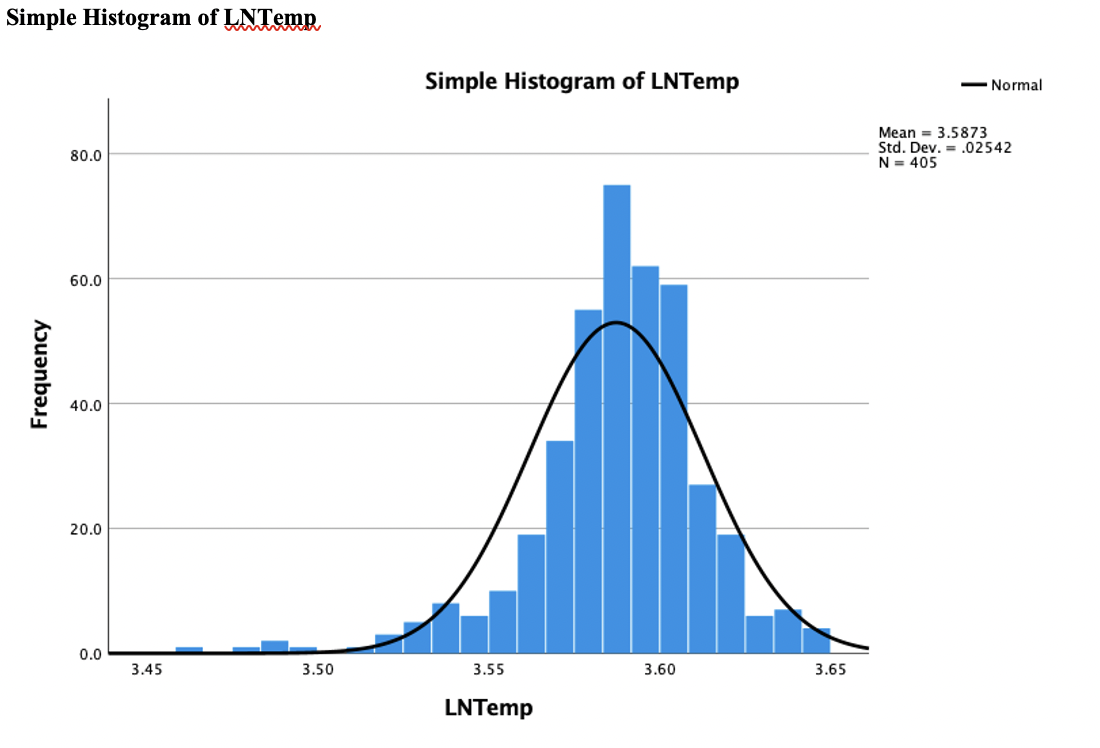
Q-Q Plot of Average Medicare Payments Normal Q-Q Plot of Average Medicare Payments 6 4 00 OBDOC 0 900 000 000 Expected Normal 0 -4 0 10,000 20,000 30,000 40,000 50,000 Observed Value Average Medicare Payments Histogram - Normal 120 Mean = 7872.22 Std. Dev. = 6189.214 N = 455 100 80 Frequency 60 40 20 0 .00 10000.00 20000.00 30000.00 40000.00 Average Medicare Payments Detrended Normal Q-Q Plot of Average Medicare Payments Detrended Normal Q-Q Plot of Average Medicare Payments 3 ooo oo Dev from Normal OOO WOOOOOO -1 0 10,000 20,000 30,000 40,000 50,000 Observed Value Average Medicare Payments 50000.00 40000.00 87,565 * 151,712* *151,708 39,965* 150,549787,537 150,555* *87,531 39,985 39,959 150,583 30000.00 109,611 87,541* 109,613110,778 46,3358 110,773843,090 20000.00 58,165 89,116 44,203050,487 10000.00 .00 Average Medicare Payments Simple Histogram of LNTemp Simple Histogram of LNTemp - Normal Mean = 3.5873 Std. Dev. = .02542 N = 405 80.0 60.0 Frequency 40.0 20.0 0.0 3.45 3.50 3.55 3.60 3.65 LNTemp Q-Q Plot of Average Medicare Payments Normal Q-Q Plot of Average Medicare Payments 6 4 00 OBDOC 0 900 000 000 Expected Normal 0 -4 0 10,000 20,000 30,000 40,000 50,000 Observed Value Average Medicare Payments Histogram - Normal 120 Mean = 7872.22 Std. Dev. = 6189.214 N = 455 100 80 Frequency 60 40 20 0 .00 10000.00 20000.00 30000.00 40000.00 Average Medicare Payments Detrended Normal Q-Q Plot of Average Medicare Payments Detrended Normal Q-Q Plot of Average Medicare Payments 3 ooo oo Dev from Normal OOO WOOOOOO -1 0 10,000 20,000 30,000 40,000 50,000 Observed Value Average Medicare Payments 50000.00 40000.00 87,565 * 151,712* *151,708 39,965* 150,549787,537 150,555* *87,531 39,985 39,959 150,583 30000.00 109,611 87,541* 109,613110,778 46,3358 110,773843,090 20000.00 58,165 89,116 44,203050,487 10000.00 .00 Average Medicare Payments Simple Histogram of LNTemp Simple Histogram of LNTemp - Normal Mean = 3.5873 Std. Dev. = .02542 N = 405 80.0 60.0 Frequency 40.0 20.0 0.0 3.45 3.50 3.55 3.60 3.65 LNTemp
Step by Step Solution
There are 3 Steps involved in it

Get step-by-step solutions from verified subject matter experts