

Question: 1 . Explain who your audience ( stakeholders ) is and why you are presenting to them. 2 . Ask three questions that you are
Explain who your audience stakeholders is and why you are presenting to them.
Ask three questions that you are interested in exploring with your data.
Do an initial analysis by creating THREE exploratory charts of your data.
Create a section for each chart where you...
aInclude the chart with appropriate titles and labeling
bDiscuss any outliers or anomalies in your data if you find any in your exploration.
cDiscuss trends you see in your data and possible areas where you will further explore your data.
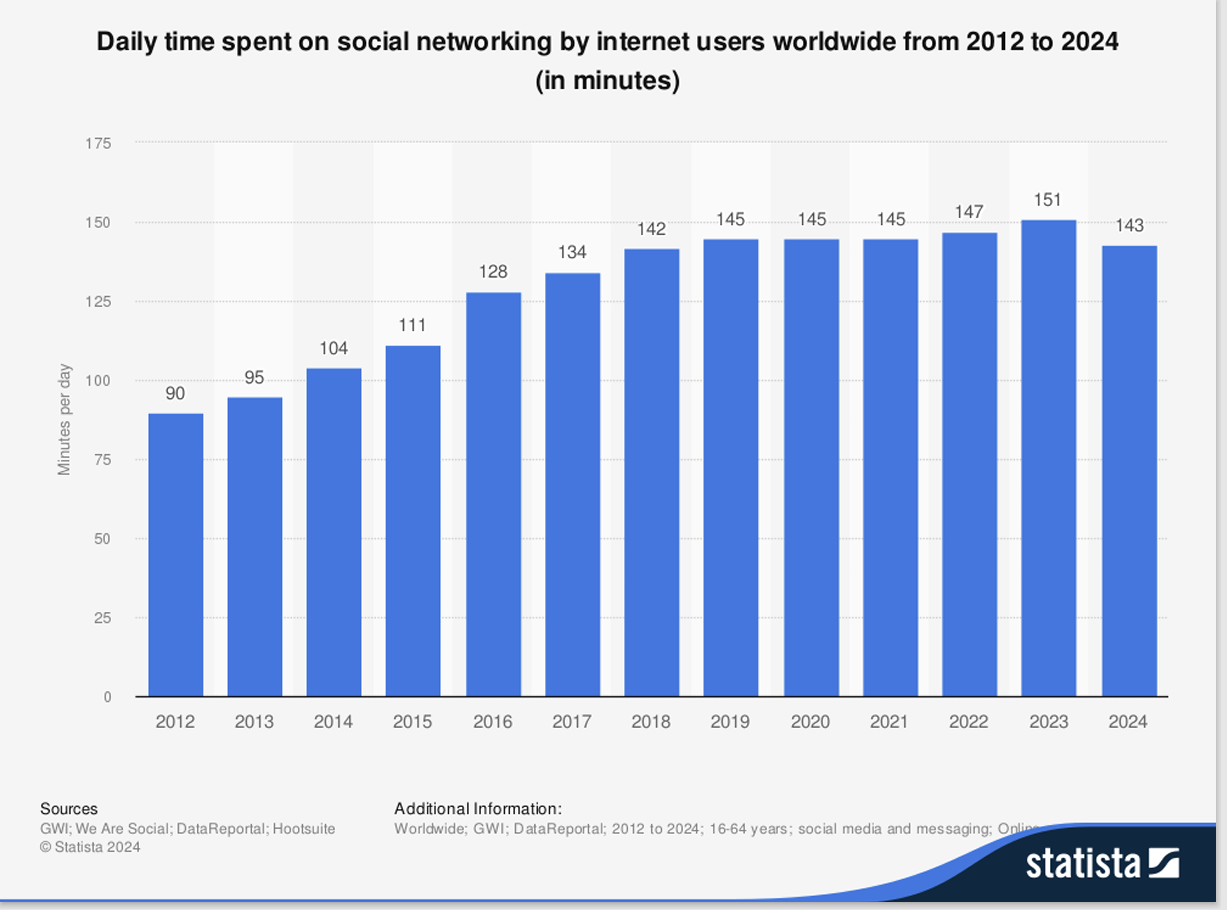
Daily time spent on social networking by internet users worldwide from to in minutes
Sources
Additional Information:
GWI; We Are Social; DataReportal; Hootsuite
Statista
Step by Step Solution
There are 3 Steps involved in it
1 Expert Approved Answer
Step: 1 Unlock

Question Has Been Solved by an Expert!
Get step-by-step solutions from verified subject matter experts
Step: 2 Unlock
Step: 3 Unlock