

Question: 1. Explain why the four at-bats is a binomial experiment. 2. Using the Bats scatter plot. construct a frequency distribution for the number of hits.
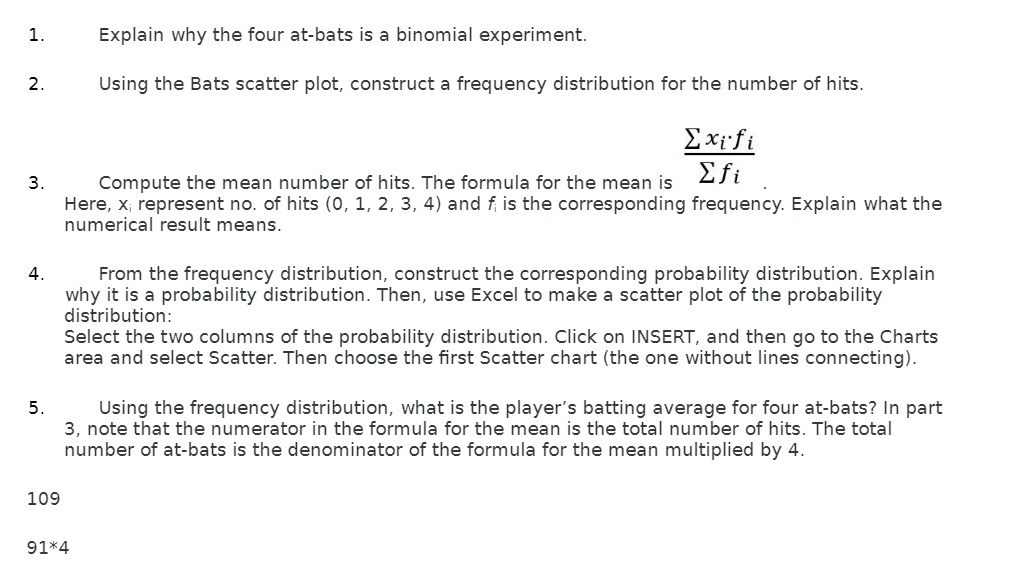
1. Explain why the four at-bats is a binomial experiment. 2. Using the Bats scatter plot. construct a frequency distribution for the number of hits. 2 xi'fi 3. Compute the mean number of hits. The formula for the mean is Zfi . Here. xi represent no. of hits {0. 1, 2, 3, 4] and fi is the corresponding frequency. Explain what the numerical result means. 4. From the frequency distribution, construct the corresponding probability distribution. Explain why it is a probability distribution. Then. use Excel to make a scatter plot of the probability distribution: Select the two columns of the probability distribution. Click on INSERT, and then go to the Charts area and select Scatter. Then choose the rst Scatter chart (the one without lines connecting). 5. Using the frequency distribution, what is the player's batting average for four at-bats? In part 3, note that the numerator in the formula for the mean is the total number of hits. The total number of at-bats is the denominator of the formula for the mean multiplied by 4. 109 91*4
Step by Step Solution
There are 3 Steps involved in it

Get step-by-step solutions from verified subject matter experts