

Question: 1 Ferrari 2 Income statement 3 Breakdown TTM 4 Total Revenue 3,758,750 5 Operating Revenue 3,651,729 6 Cost of Revenue 1,794,515 7 Gross Profit 1.964
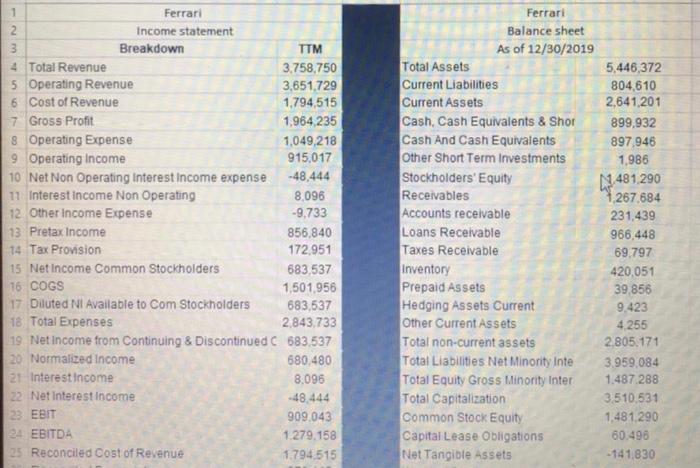
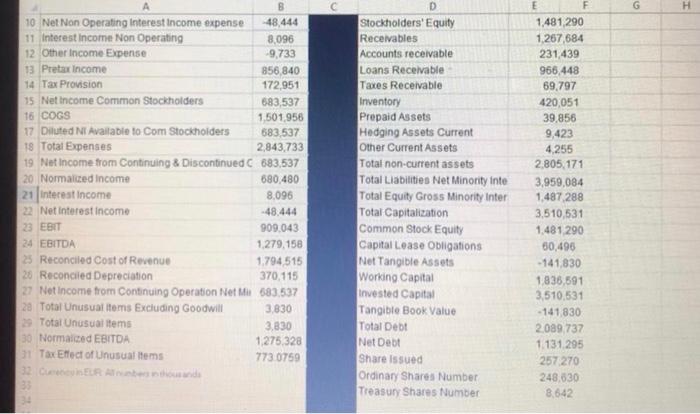
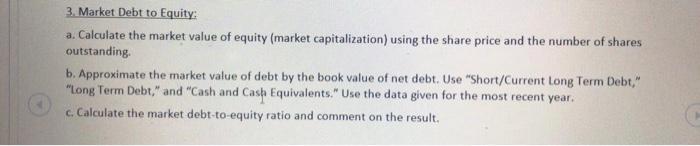
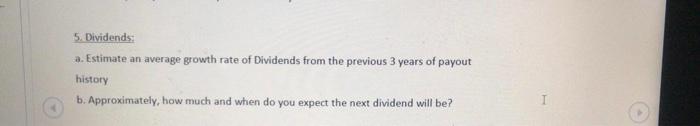
1 Ferrari 2 Income statement 3 Breakdown TTM 4 Total Revenue 3,758,750 5 Operating Revenue 3,651,729 6 Cost of Revenue 1,794,515 7 Gross Profit 1.964 235 8 Operating Expense 1,049,218 9 Operating Income 915,017 10 Net Non Operating interest Income expense -48,444 11 Interest Income Non Operating 8,096 12. Other Income Expense -9.733 13 Pretax Income 856,840 14 Tax Provision 172.951 15 Net Income Common Stockholders 683.537 16 COGS 1,501,956 17 Diluted NI Available to Com Stockholders 683,537 18. Total Expenses 2.843.733 19 Net Income from Continuing & Discontinued C 583.537 20 Normalized Income 680.480 21 Interest income 8,096 22 Net interest income -48 444 23 EBIT 909.043 24 EBITDA 1.279.158 25 Reconciled cost of Revenue 1.794 515 Ferrari Balance sheet As of 12/30/2019 Total Assets Current Liabilities Current Assets Cash Cash Equivalents & Shor Cash And Cash Equivalents Other Short Term Investments Stockholders' Equity Receivables Accounts receivable Loans Receivable Taxes Receivable Inventory Prepaid Assets Hedging Assets Current Other Current Assets Total non-current assets Total Liabilities Net Minority inte Total Equity Gross Minority Inter Total Capitalization Common Stock Equity Capital Lease Obligations Net Tangible Assets 5,446,372 804,610 2,641,201 899,932 897,946 1,986 N 481290 1,267,684 231,439 966,448 69.797 420,051 39,856 9,423 4.255 2,805.171 3.959.084 1.487.288 3,510,531 1,481,290 60.498 -141.830 G H 10 Net Non Operating interest Income expense 48,444 11 Interest Income Non Operating 8,096 12 Other Income Expense -9,733 13 Pretax income 856,840 14 Tax Provision 172,951 15 Net Income Common Stockholders 683,537 16 COGS 1.501,956 17 Diluted Ni Available to Com Stockholders 683.537 18 Total Expenses 2,843.733 19 Net Income from Continuing & Discontinued C 683,537 20 Normalced Income 680,480 21 interest Income 8,096 22 Net interest income -48.444 23 EBIT 909.043 24 EBITDA 1279.158 25 Reconciled Cost of Revenue 1.794 515 26 Reconciled Depreciation 370,115 27 Net Income from Continuing Operation Net M 683,537 20 Total Unusual Items Excluding Goodwill 3.830 29 Total Unusual items 3,830 30 Normalced EBITDA 1,275,328 31 Tax Effect of unusual Items 773 0759 Stockholders' Equity Receivables Accounts receivable Loans Receivable Taxes Receivable Inventory Prepaid Assets Hedging Assets Current Other Current Assets Total non-current assets Total Liabilities Net Minority inte Total Equity Gross Minority Inter Total Capitalization Common Stock Equity Capital Lease Obligations Net Tangible Assets Working Capital Invested Capital Tangible Book Value Total Debt Net Det Share issued Ordinary Shares Number Treasury Shares Number E F 1,481 290 1,267,684 231,439 966,448 69,797 420,051 39,856 9,423 4,255 2,805,171 3,959,084 1.487 288 3.510,531 1.481 290 30,496 - 141.830 1836,591 3,510,531 - 141.830 2089, 737 1.131.295 257 270 248,630 8.642 33 3. Market Debt to Equity: a. Calculate the market value of equity (market capitalization) using the share price and the number of shares outstanding b. Approximate the market value of debt by the book value of net debt. Use "Short/Current Long Term Debt," "Long Term Debt," and "Cash and Cash Equivalents." Use the data given for the most recent year. c. Calculate the market debt-to-equity ratio and comment on the result. 5. Dividends, a. Estimate an average growth rate of Dividends from the previous 3 years of payout history b. Approximately, how much and when do you expect the next dividend will be? 1 Ferrari 2 Income statement 3 Breakdown TTM 4 Total Revenue 3,758,750 5 Operating Revenue 3,651,729 6 Cost of Revenue 1,794,515 7 Gross Profit 1.964 235 8 Operating Expense 1,049,218 9 Operating Income 915,017 10 Net Non Operating interest Income expense -48,444 11 Interest Income Non Operating 8,096 12. Other Income Expense -9.733 13 Pretax Income 856,840 14 Tax Provision 172.951 15 Net Income Common Stockholders 683.537 16 COGS 1,501,956 17 Diluted NI Available to Com Stockholders 683,537 18. Total Expenses 2.843.733 19 Net Income from Continuing & Discontinued C 583.537 20 Normalized Income 680.480 21 Interest income 8,096 22 Net interest income -48 444 23 EBIT 909.043 24 EBITDA 1.279.158 25 Reconciled cost of Revenue 1.794 515 Ferrari Balance sheet As of 12/30/2019 Total Assets Current Liabilities Current Assets Cash Cash Equivalents & Shor Cash And Cash Equivalents Other Short Term Investments Stockholders' Equity Receivables Accounts receivable Loans Receivable Taxes Receivable Inventory Prepaid Assets Hedging Assets Current Other Current Assets Total non-current assets Total Liabilities Net Minority inte Total Equity Gross Minority Inter Total Capitalization Common Stock Equity Capital Lease Obligations Net Tangible Assets 5,446,372 804,610 2,641,201 899,932 897,946 1,986 N 481290 1,267,684 231,439 966,448 69.797 420,051 39,856 9,423 4.255 2,805.171 3.959.084 1.487.288 3,510,531 1,481,290 60.498 -141.830 G H 10 Net Non Operating interest Income expense 48,444 11 Interest Income Non Operating 8,096 12 Other Income Expense -9,733 13 Pretax income 856,840 14 Tax Provision 172,951 15 Net Income Common Stockholders 683,537 16 COGS 1.501,956 17 Diluted Ni Available to Com Stockholders 683.537 18 Total Expenses 2,843.733 19 Net Income from Continuing & Discontinued C 683,537 20 Normalced Income 680,480 21 interest Income 8,096 22 Net interest income -48.444 23 EBIT 909.043 24 EBITDA 1279.158 25 Reconciled Cost of Revenue 1.794 515 26 Reconciled Depreciation 370,115 27 Net Income from Continuing Operation Net M 683,537 20 Total Unusual Items Excluding Goodwill 3.830 29 Total Unusual items 3,830 30 Normalced EBITDA 1,275,328 31 Tax Effect of unusual Items 773 0759 Stockholders' Equity Receivables Accounts receivable Loans Receivable Taxes Receivable Inventory Prepaid Assets Hedging Assets Current Other Current Assets Total non-current assets Total Liabilities Net Minority inte Total Equity Gross Minority Inter Total Capitalization Common Stock Equity Capital Lease Obligations Net Tangible Assets Working Capital Invested Capital Tangible Book Value Total Debt Net Det Share issued Ordinary Shares Number Treasury Shares Number E F 1,481 290 1,267,684 231,439 966,448 69,797 420,051 39,856 9,423 4,255 2,805,171 3,959,084 1.487 288 3.510,531 1.481 290 30,496 - 141.830 1836,591 3,510,531 - 141.830 2089, 737 1.131.295 257 270 248,630 8.642 33 3. Market Debt to Equity: a. Calculate the market value of equity (market capitalization) using the share price and the number of shares outstanding b. Approximate the market value of debt by the book value of net debt. Use "Short/Current Long Term Debt," "Long Term Debt," and "Cash and Cash Equivalents." Use the data given for the most recent year. c. Calculate the market debt-to-equity ratio and comment on the result. 5. Dividends, a. Estimate an average growth rate of Dividends from the previous 3 years of payout history b. Approximately, how much and when do you expect the next dividend will be
Step by Step Solution
There are 3 Steps involved in it

Get step-by-step solutions from verified subject matter experts