

Question: 1 Fig. 1.1 shows a speed-time graph for a student who is running. 5 speed 4 m/s 3 2 1 0+ 0 10 20 30
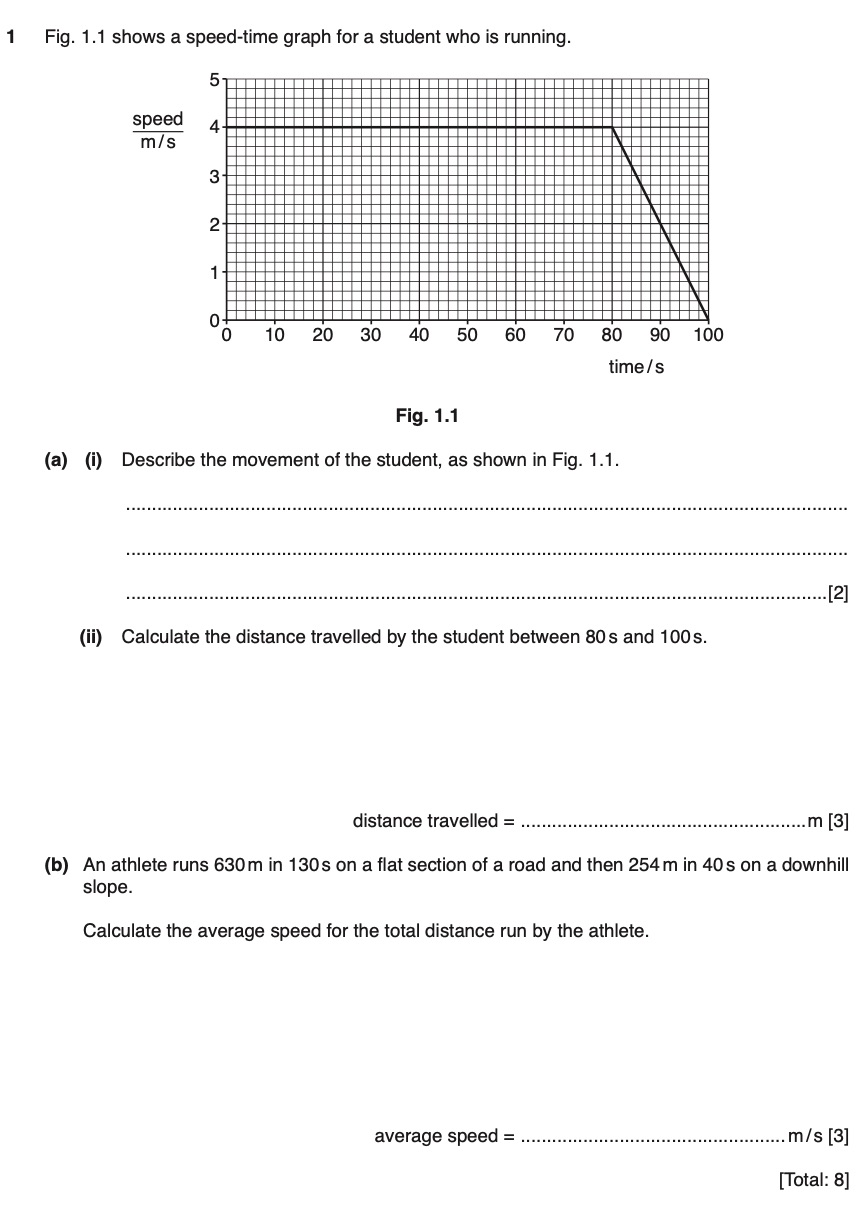
1 Fig. 1.1 shows a speed-time graph for a student who is running. 5 speed 4 m/s 3 2 1 0+ 0 10 20 30 40 50 60 70 80 90 100 time / s Fig. 1.1 (a) (i) Describe the movement of the student, as shown in Fig. 1.1. [2] (ii) Calculate the distance travelled by the student between 80s and 100s. distance travelled = ............ (b) An athlete runs 630m in 130s on a flat section of a road and then 254m in 40s on a downhill slope. Calculate the average speed for the total distance run by the athlete. average speed = ............". ............ m/ S [3] [Total: 8]
Step by Step Solution
There are 3 Steps involved in it
1 Expert Approved Answer
Step: 1 Unlock

Question Has Been Solved by an Expert!
Get step-by-step solutions from verified subject matter experts
Step: 2 Unlock
Step: 3 Unlock