

Question: 1. Financial Statements Analysis and Comparison Please use the data in the tables below to answer the following set of questions. Please use only the
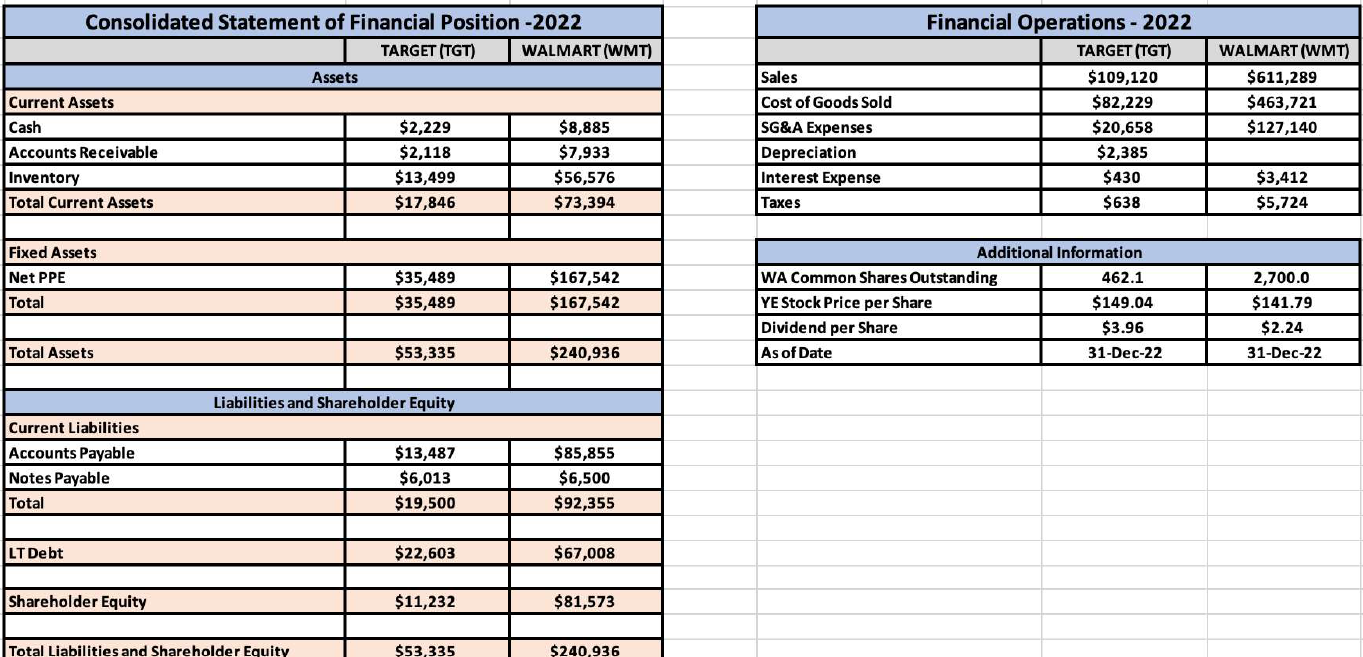
1. Financial Statements Analysis and Comparison Please use the data in the tables below to answer the following set of questions. Please use only the information provided and show step by step calculations/workings to support your answers.
Step by Step Solution
There are 3 Steps involved in it
1 Expert Approved Answer
Step: 1 Unlock

Question Has Been Solved by an Expert!
Get step-by-step solutions from verified subject matter experts
Step: 2 Unlock
Step: 3 Unlock