

Question: 1. Find the file OPM 101_Homework 4_Data on CANVAS. This file contains 20 samples collected from a cosmetic manufacturing line. The data indicates the skin
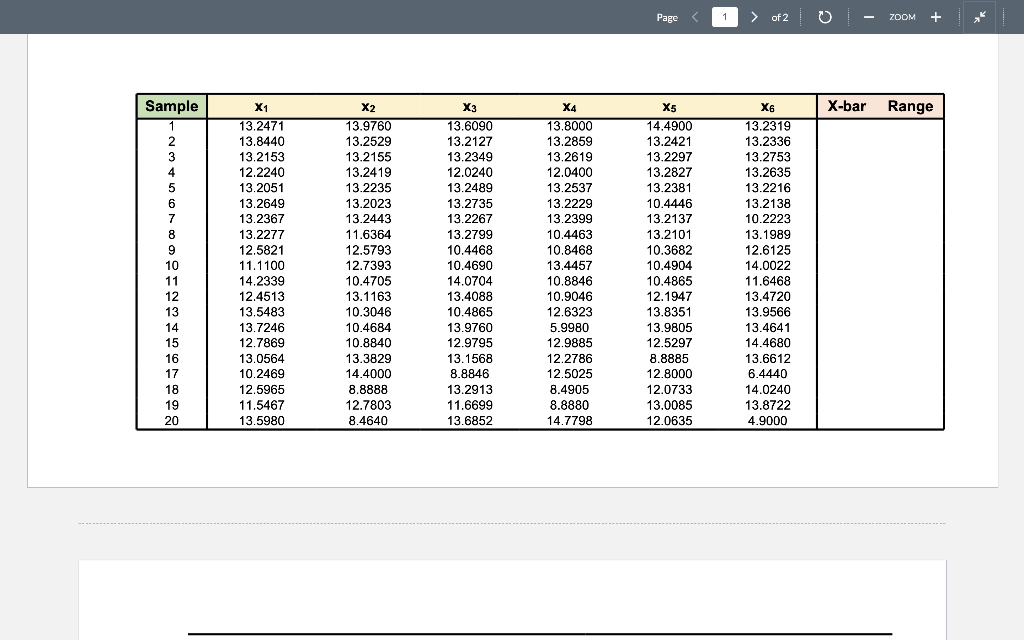
1. Find the file "OPM 101_Homework 4_Data" on CANVAS. This file contains 20 samples collected from a cosmetic manufacturing line. The data indicates the skin sensitivity level to a har color. The Excel file also has the A2D3,D4, and d2 table on the second sheet. Please write "see attachment" in the answer space if you do graphics in Excel file and you want to attach it to your homework. Please try to use Excel, otherwise you may have to do a lot of computation by hand. (a) Construct an X-bar chart for this manufacturing line: i. Is this process "in control"? ii. Do you notice any problems despite your answer to Part i? (b) Construct an R-Chart for this manufacturing line: (b) Construct an R-Chart for this manufacturing line: I. Is this process "in control"? ii. Based on your calculation for the X-Bar Chart and R-Chart, compare your answers regarding the "in control" question? Do the charts result differently? Why or Why Not
Step by Step Solution
There are 3 Steps involved in it

Get step-by-step solutions from verified subject matter experts