

Question: 1. For each set of sample outcomes below, construct the 99% confidence interval for estimating the population proportion and interpret your finding. [(1+.5) + (1+.5)
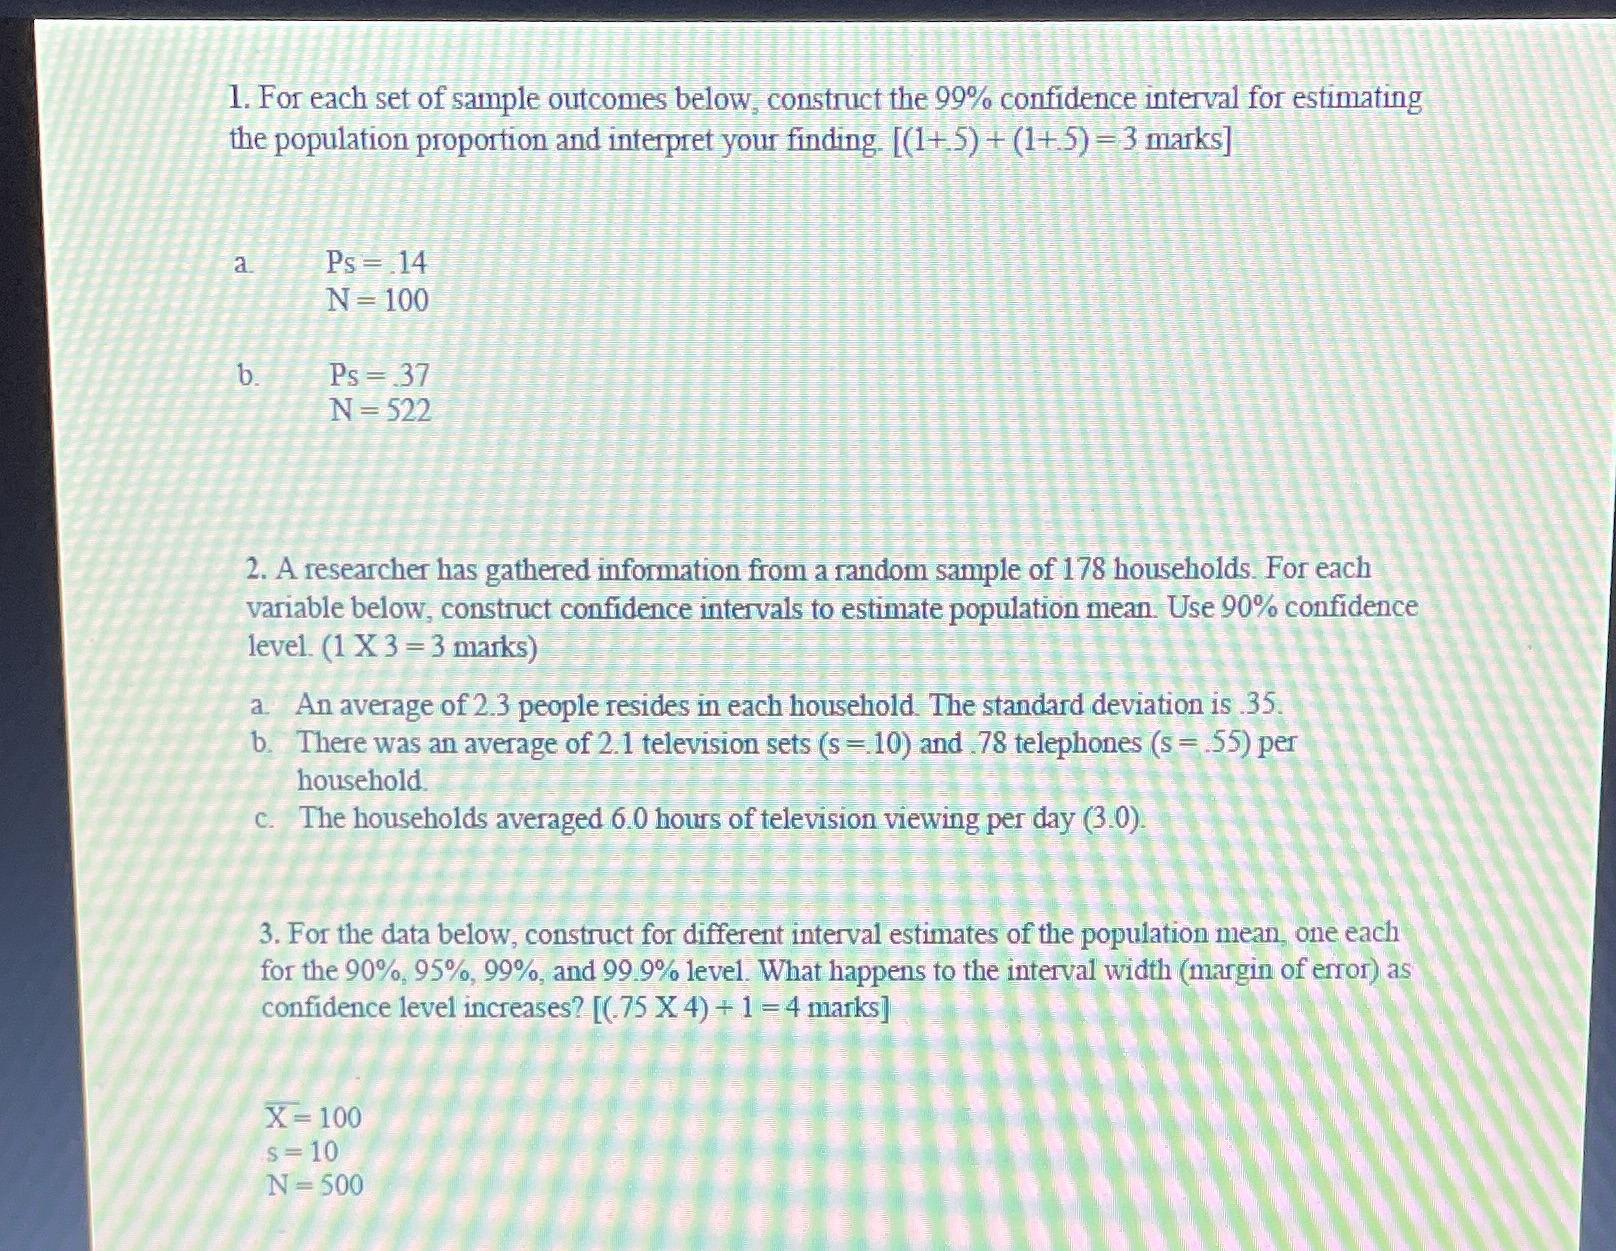

1. For each set of sample outcomes below, construct the 99% confidence interval for estimating the population proportion and interpret your finding. [(1+.5) + (1+.5) =3 marks] a Ps = .14 N = 100 b Ps = 37 N= 522 2. A researcher has gathered information from a random sample of 178 households. For each variable below, construct confidence intervals to estimate population mean. Use 90% confidence level. (1 X 3 = 3 marks) a. An average of 2.3 people resides in each household. The standard deviation is 35. b. There was an average of 2.1 television sets (s =.10) and .78 telephones (s = 155) per household. C. The households averaged 6.0 hours of television viewing per day (3.0) 3. For the data below, construct for different interval estimates of the population mean, one each for the 90%, 95%, 99%, and 99.9% level. What happens to the interval width (margin of error) as confidence level increases? [(.75 X 4) + 1 =4 marks] X =100 s = 10 N = 500
Step by Step Solution
There are 3 Steps involved in it

Get step-by-step solutions from verified subject matter experts