

Question: 1. For Procter and Gamble, what was the Gross Margin Percentage for 2018? Round to nearest one decimal point and use the % symbol. 2.
1. For Procter and Gamble, what was the Gross Margin Percentage for 2018? Round to nearest one decimal point and use the % symbol.
2. Operating income for Procter and Gamble in 2018 was: Round to nearest $billion and use $ symbol. (i.e. if the calculator answer is $1,750,000,000, then place $2 )
3. Return on Sales for Procter and Gamble for 2018 was: (round to nearest whole number and use % symbol.) Hint....Net income is the bottom line of the income statement.
4. For Procter and Gamble, what was fixed charge coverage for 2018. Your answer should round to the nearest one decimal point and be in the form of....8.3x. In other words, use the x at the end of your answer.
5. For Procter and Gamble, what were days Receivable for 2018? Round to the nearest day and answer in the form of 54 days
6. Capital expenditures for Procter and Gamble in 2018 were. Round to nearest $billion and use the $ symbol. Do not show as a negative number. (i.e. if the detailed answer is something like $76,009,234,897, then you would place $76)
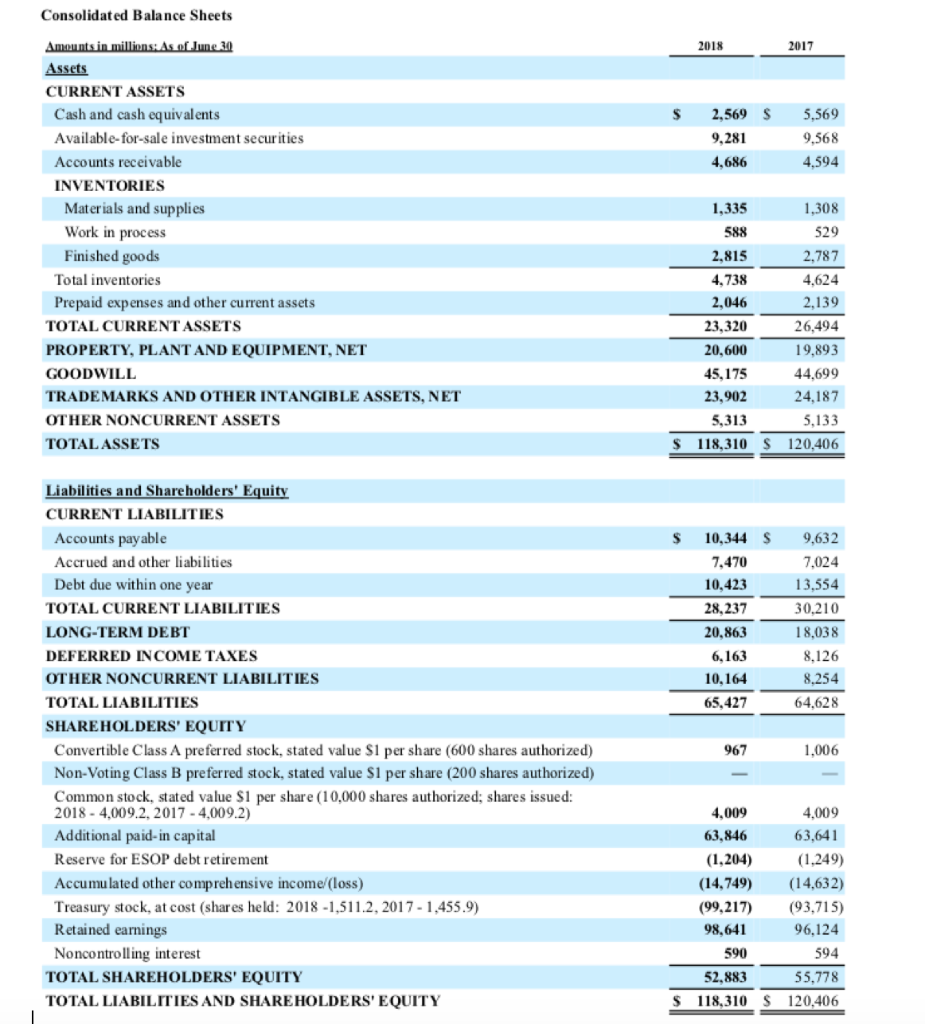
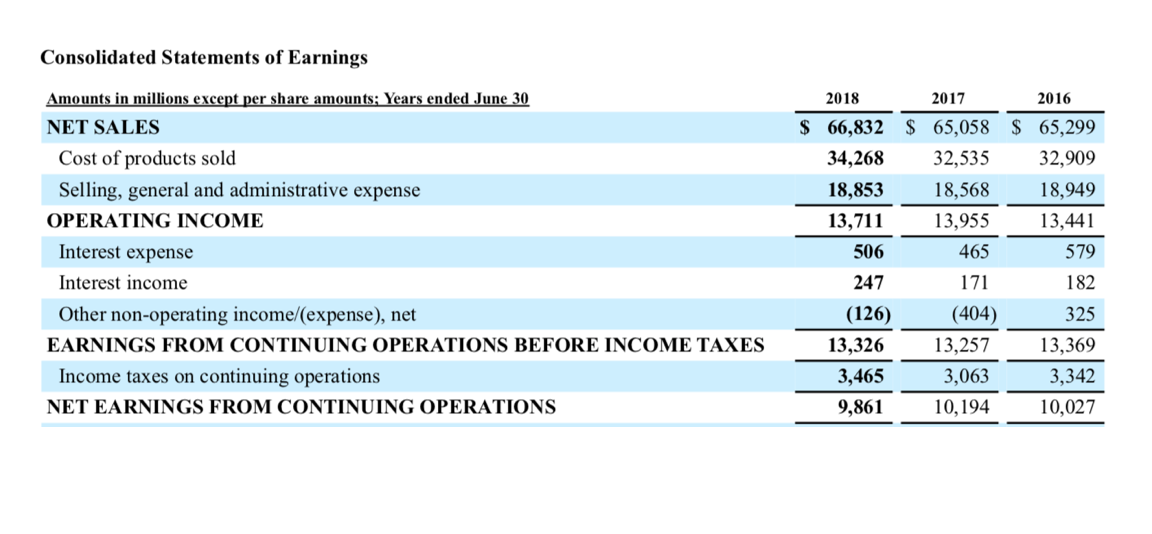
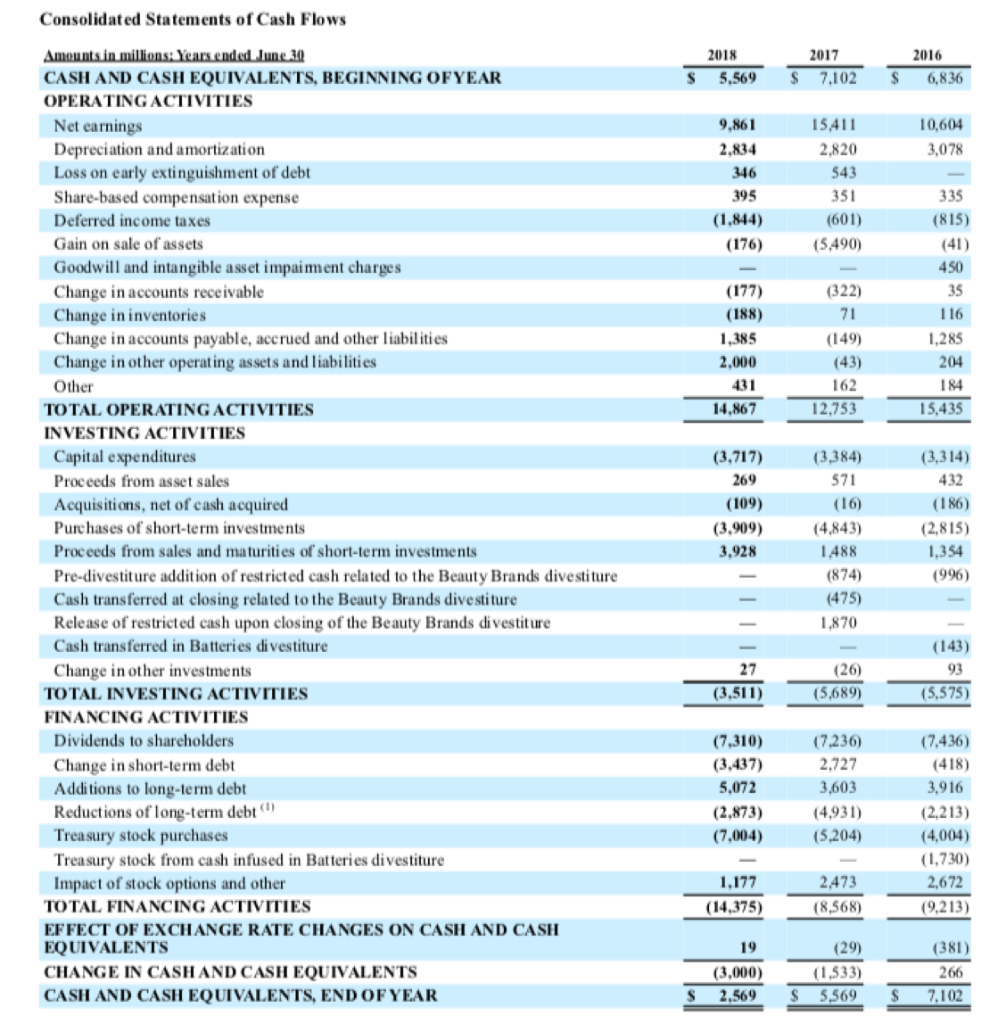
Consolidated Balance Sheets 2018 2017 2,569 $ 9,281 5,569 9,568 4,594 4.686 Amounts in millions: As of June 30 Assets CURRENT ASSETS Cash and cash equivalents Available-for-sale investment securities Accounts receivable INVENTORIES Materials and supplies Work in process Finished goods Total inventories Prepaid expenses and other current assets TOTAL CURRENT ASSETS PROPERTY, PLANT AND EQUIPMENT, NET GOODWILL TRADEMARKS AND OTHER INTANGIBLE ASSETS, NET OTHER NONCURRENT ASSETS TOTAL ASSETS 1,335 588 2,815 4.738 2,046 23,320 20,600 45,175 23,902 5,313 118,310 S 1,308 529 2,787 4,624 2,139 26,494 19,893 44,699 24,187 5,133 120,406 S S S 9,632 10,344 7,470 10,423 28,237 20,863 6,163 10,164 65,427 7,024 13,554 30,210 18,038 8.126 8.254 64,628 Liabilities and Shareholders' Equity CURRENT LIABILITIES Accounts payable Accrued and other liabilities Debt due within one year TOTAL CURRENT LIABILITIES LONG-TERM DEBT DEFERRED INCOME TAXES OTHER NONCURRENT LIABILITIES TOTAL LIABILITIES SHAREHOLDERS' EQUITY Convertible Class A preferred stock, stated value S1 per share (600 shares authorized) Non-Voting Class B preferred stock, stated value $1 per share (200 shares authorized) Common stock, stated value $1 per share (10,000 shares authorized; shares issued: 2018 - 4,009.2, 2017 - 4,009.2) Additional paid-in capital Reserve for ESOP debt retirement Accumulated other comprehensive income/loss) Treasury stock, at cost (shares held: 2018-1,511.2, 2017 - 1,455.9) Retained earnings Noncontrolling interest TOTAL SHAREHOLDERS' EQUITY TOTAL LIABILITIES AND SHAREHOLDERS' EQUITY 967 1,006 4,009 63,846 (1,204) (14,749) (99,217) 98,641 590 52,883 118,310 4,009 63,641 (1,249) (14,632) (93,715) 96,124 594 55,778 120,406 Consolidated Statements of Earnings 2018 2017 2016 Amounts in millions except per share amounts; Years ended June 30 NET SALES Cost of products sold Selling, general and administrative expense OPERATING INCOME Interest expense Interest income $ 66,832 $ 65,058 $ 65,299 34,268 32,535 32,909 18,853 18,568 18,949 13,711 13,955 13,441 506 465 579 247 171 182 (126) (404) 325 13,326 13,257 13,369 3,465 3,063 3,342 9,861 10,194 10,027 Other non-operating income/expense), net EARNINGS FROM CONTINUING OPERATIONS BEFORE INCOME TAXES Income taxes on continuing operations NET EARNINGS FROM CONTINUING OPERATIONS Consolidated Statements of Cash Flows 2018 5,569 2017 7.102 2016 6,836 S $ S 10,604 3,078 9.861 2.834 346 395 (1.844) (176) 15,411 2,820 543 351 (601) (5,490) (177) (188) 1,385 2.000 431 14,867 (322) 71 (149) (43) 162 12,753 335 (815) (41) 450 35 116 1.285 204 184 15,435 Amounts in millions: Years ended June 30 CASH AND CASH EQUIVALENTS, BEGINNING OF YEAR OPERATING ACTIVITIES Net earnings Depreciation and amortization Loss on early extinguishment of debt Share-based compensation expense Deferred income taxes Gain on sale of assets Goodwill and intangible asset impaiment charges Change in accounts receivable Change in inventories Change in accounts payable, accrued and other liabilities Change in other operating assets and liabilities Other TOTAL OPERATING ACTIVITIES INVESTING ACTIVITIES Capital expenditures Proceeds from asset sales Acquisitions, net of cash acquired Purchases of short-term investments Proceeds from sales and maturities of short-term investments Pre-divestiture addition of restricted cash related to the Beauty Brands divestiture Cash transferred at closing related to the Beauty Brands divestiture Release of restricted cash upon closing of the Beauty Brands divestiture Cash transferred in Batteries divestiture Change in other investments TOTAL INVESTING ACTIVITIES FINANCING ACTIVITIES Dividends to shareholders Change in short-term debt Additions to long-term debt Reductions of long-term debt Treasury stock purchases Treasury stock from cash infused in Batteries divestiture Impact of stock options and other TOTAL FINANCING ACTIVITIES EFFECT OF EXCHANGE RATE CHANGES ON CASH AND CASH EQUIVALENTS CHANGE IN CASH AND CASH EQUIVALENTS CASH AND CASH EQUIVALENTS, END OF YEAR (3,717) 269 (109) (3,909) 3,928 (3,384) 571 (16) (4.843) 1.488 (874) (475) 1.870 (3,314) 432 (186) (2,815) 1,354 (996) 27 (3,511) (26) (5,689) (143) 93 (5,575) (7,310) (3,437) 5,072 (2.873) (7,004) (7.236) 2,727 3,603 (4,931) (5,204) (7.436) (418) 3,916 (2,213) (4,004) (1.730) 2,672 (9,213) 1,177 (14.375) 2,473 (8,568) 19 (3.000) 2.569 (29) (1.533) 5,569 (381) 266 7.102 S S Consolidated Balance Sheets 2018 2017 2,569 $ 9,281 5,569 9,568 4,594 4.686 Amounts in millions: As of June 30 Assets CURRENT ASSETS Cash and cash equivalents Available-for-sale investment securities Accounts receivable INVENTORIES Materials and supplies Work in process Finished goods Total inventories Prepaid expenses and other current assets TOTAL CURRENT ASSETS PROPERTY, PLANT AND EQUIPMENT, NET GOODWILL TRADEMARKS AND OTHER INTANGIBLE ASSETS, NET OTHER NONCURRENT ASSETS TOTAL ASSETS 1,335 588 2,815 4.738 2,046 23,320 20,600 45,175 23,902 5,313 118,310 S 1,308 529 2,787 4,624 2,139 26,494 19,893 44,699 24,187 5,133 120,406 S S S 9,632 10,344 7,470 10,423 28,237 20,863 6,163 10,164 65,427 7,024 13,554 30,210 18,038 8.126 8.254 64,628 Liabilities and Shareholders' Equity CURRENT LIABILITIES Accounts payable Accrued and other liabilities Debt due within one year TOTAL CURRENT LIABILITIES LONG-TERM DEBT DEFERRED INCOME TAXES OTHER NONCURRENT LIABILITIES TOTAL LIABILITIES SHAREHOLDERS' EQUITY Convertible Class A preferred stock, stated value S1 per share (600 shares authorized) Non-Voting Class B preferred stock, stated value $1 per share (200 shares authorized) Common stock, stated value $1 per share (10,000 shares authorized; shares issued: 2018 - 4,009.2, 2017 - 4,009.2) Additional paid-in capital Reserve for ESOP debt retirement Accumulated other comprehensive income/loss) Treasury stock, at cost (shares held: 2018-1,511.2, 2017 - 1,455.9) Retained earnings Noncontrolling interest TOTAL SHAREHOLDERS' EQUITY TOTAL LIABILITIES AND SHAREHOLDERS' EQUITY 967 1,006 4,009 63,846 (1,204) (14,749) (99,217) 98,641 590 52,883 118,310 4,009 63,641 (1,249) (14,632) (93,715) 96,124 594 55,778 120,406 Consolidated Statements of Earnings 2018 2017 2016 Amounts in millions except per share amounts; Years ended June 30 NET SALES Cost of products sold Selling, general and administrative expense OPERATING INCOME Interest expense Interest income $ 66,832 $ 65,058 $ 65,299 34,268 32,535 32,909 18,853 18,568 18,949 13,711 13,955 13,441 506 465 579 247 171 182 (126) (404) 325 13,326 13,257 13,369 3,465 3,063 3,342 9,861 10,194 10,027 Other non-operating income/expense), net EARNINGS FROM CONTINUING OPERATIONS BEFORE INCOME TAXES Income taxes on continuing operations NET EARNINGS FROM CONTINUING OPERATIONS Consolidated Statements of Cash Flows 2018 5,569 2017 7.102 2016 6,836 S $ S 10,604 3,078 9.861 2.834 346 395 (1.844) (176) 15,411 2,820 543 351 (601) (5,490) (177) (188) 1,385 2.000 431 14,867 (322) 71 (149) (43) 162 12,753 335 (815) (41) 450 35 116 1.285 204 184 15,435 Amounts in millions: Years ended June 30 CASH AND CASH EQUIVALENTS, BEGINNING OF YEAR OPERATING ACTIVITIES Net earnings Depreciation and amortization Loss on early extinguishment of debt Share-based compensation expense Deferred income taxes Gain on sale of assets Goodwill and intangible asset impaiment charges Change in accounts receivable Change in inventories Change in accounts payable, accrued and other liabilities Change in other operating assets and liabilities Other TOTAL OPERATING ACTIVITIES INVESTING ACTIVITIES Capital expenditures Proceeds from asset sales Acquisitions, net of cash acquired Purchases of short-term investments Proceeds from sales and maturities of short-term investments Pre-divestiture addition of restricted cash related to the Beauty Brands divestiture Cash transferred at closing related to the Beauty Brands divestiture Release of restricted cash upon closing of the Beauty Brands divestiture Cash transferred in Batteries divestiture Change in other investments TOTAL INVESTING ACTIVITIES FINANCING ACTIVITIES Dividends to shareholders Change in short-term debt Additions to long-term debt Reductions of long-term debt Treasury stock purchases Treasury stock from cash infused in Batteries divestiture Impact of stock options and other TOTAL FINANCING ACTIVITIES EFFECT OF EXCHANGE RATE CHANGES ON CASH AND CASH EQUIVALENTS CHANGE IN CASH AND CASH EQUIVALENTS CASH AND CASH EQUIVALENTS, END OF YEAR (3,717) 269 (109) (3,909) 3,928 (3,384) 571 (16) (4.843) 1.488 (874) (475) 1.870 (3,314) 432 (186) (2,815) 1,354 (996) 27 (3,511) (26) (5,689) (143) 93 (5,575) (7,310) (3,437) 5,072 (2.873) (7,004) (7.236) 2,727 3,603 (4,931) (5,204) (7.436) (418) 3,916 (2,213) (4,004) (1.730) 2,672 (9,213) 1,177 (14.375) 2,473 (8,568) 19 (3.000) 2.569 (29) (1.533) 5,569 (381) 266 7.102 S S
Step by Step Solution
There are 3 Steps involved in it

Get step-by-step solutions from verified subject matter experts