

Question: 1) For the accompanying data set, (a) draw a scatter diagram of the data, (b) by hand, compute the correlation coefficient, and (c) determine whether

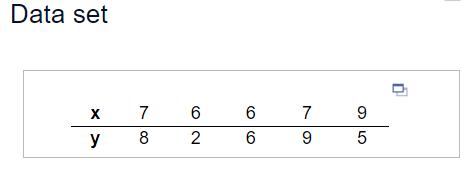
1) For the accompanying data set, (a) draw a scatter diagram of the data, (b) by hand, compute the correlation coefficient, and (c) determine whether there is a linear relation between x and y.
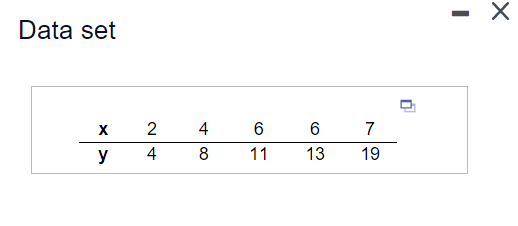


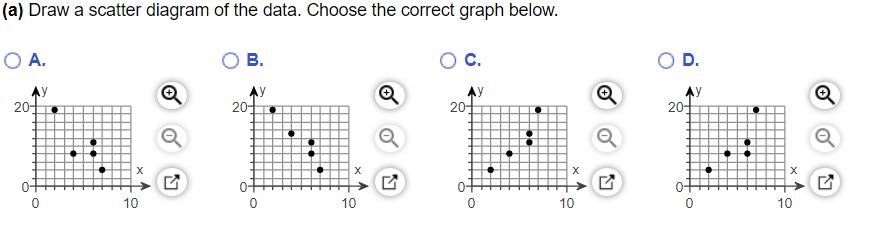


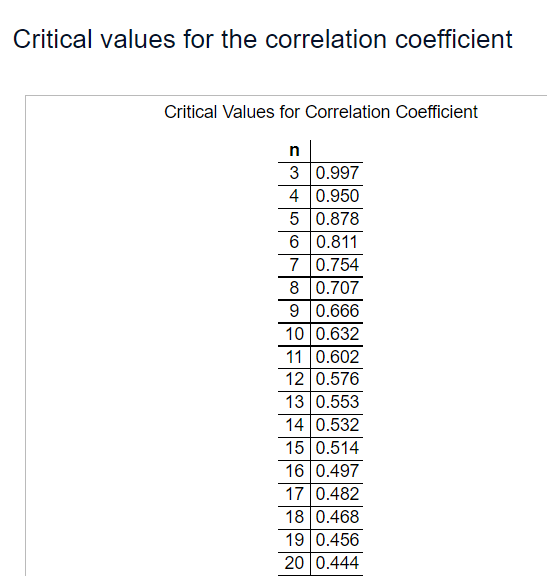
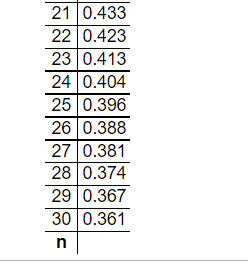
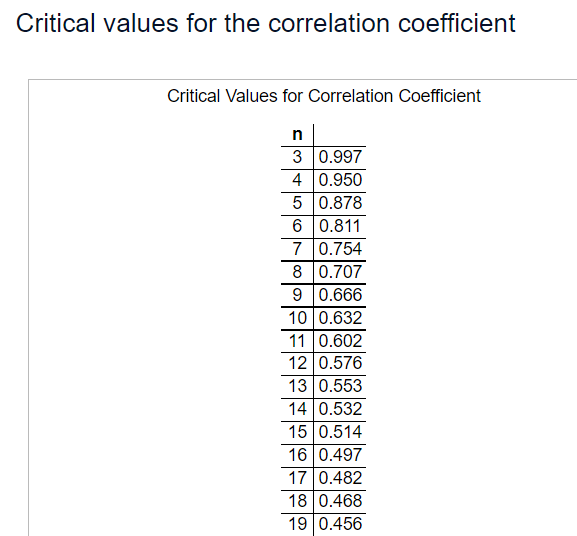
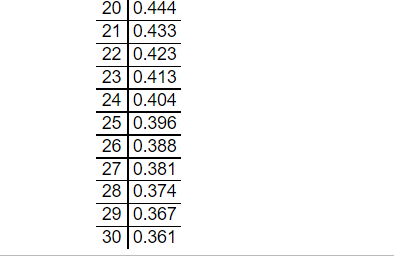
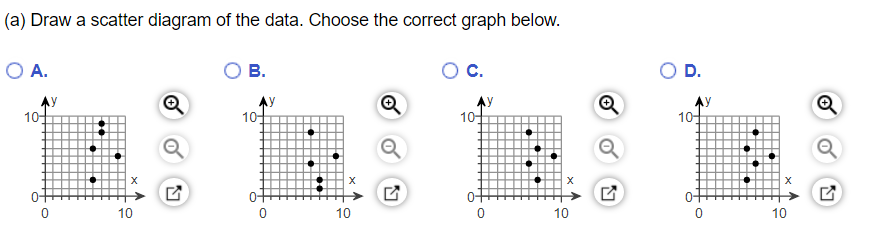
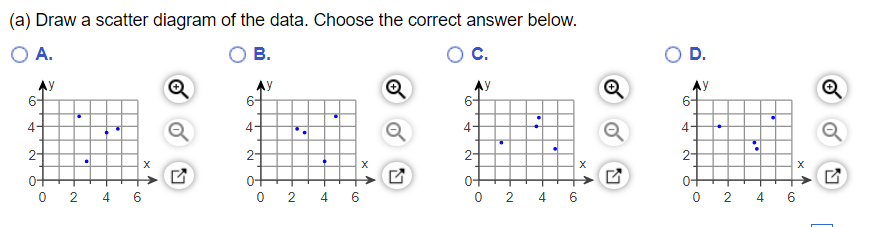
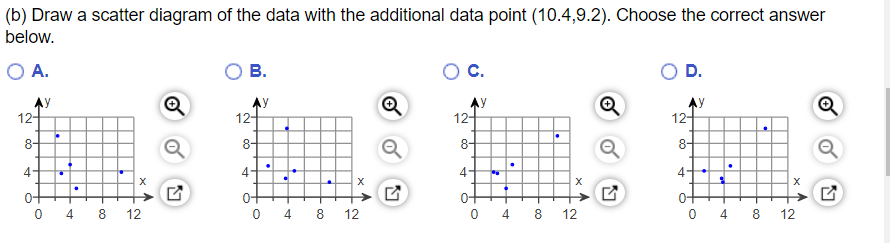
\fCritical values for the correlation coefficient Critical Values for Correlation Coefficient n 3 0.997 4 0.950 5 0.878 6 0.811 7 0.754 8 0.707 9 0.666 10 0.632 11 0.602 12 0.576 13 0.553 14 0.532 15 0.514 16 0.497 17 0.482 18 0.468 19 0.456 20 0.44421 0.433 22 0.423 23 0.413 24 0.404 25 0.396 26 0.388 27 0.381 28 0.374 29 0.367 30 0.361 n(a) Draw a scatter diagram of the data. Choose the correct graph below. O A. O B. Ay 20- O C. Ay 20- + OD. Ay 20- + Ay 20- X + X 10 0 X 10 0 X 10 0 10\fCritical values for the correlation coefficient Critical Values for Correlation Coefficient n 3 10.997 4 0.950 5 0.878 6 0.811 7 0.754 8 10.707 9 0.666 10 0.632 11 0.602 12 0.576 13 0.553 14 0.532 15 0.514 16 0.497 17 0.482 18 0.468 19 0.456\f(a) Draw a scatter diagram of the data. Choose the correct graph below. O A. O B. O C. OD. + + + X X X 0 X 10 0 10 0 10 0 10(a) Draw a scatter diagram of the data. Choose the correct answer below. O A. O B. O C. OD. Ay 6- Ay 6- Ay 4 4 . . 4- 4- X 2 X 2- 2 0- X 0 X 2 4 6 0- 0 2 4 6 0 2 4 6 O 2 4 6below. (b) Draw a scatter diagram of the data with the additional data point (10.4,9.2). Choose the correct answer O A. O B. O C. O D. Ay 12- Ay 124 Ay 12/ Ay 8- 12- 8- 4 8- 4 X X 4 4 X X 0 4 8 12 0 4 8 12 0 4 8 12 0 4 8 12
Step by Step Solution
There are 3 Steps involved in it

Get step-by-step solutions from verified subject matter experts