

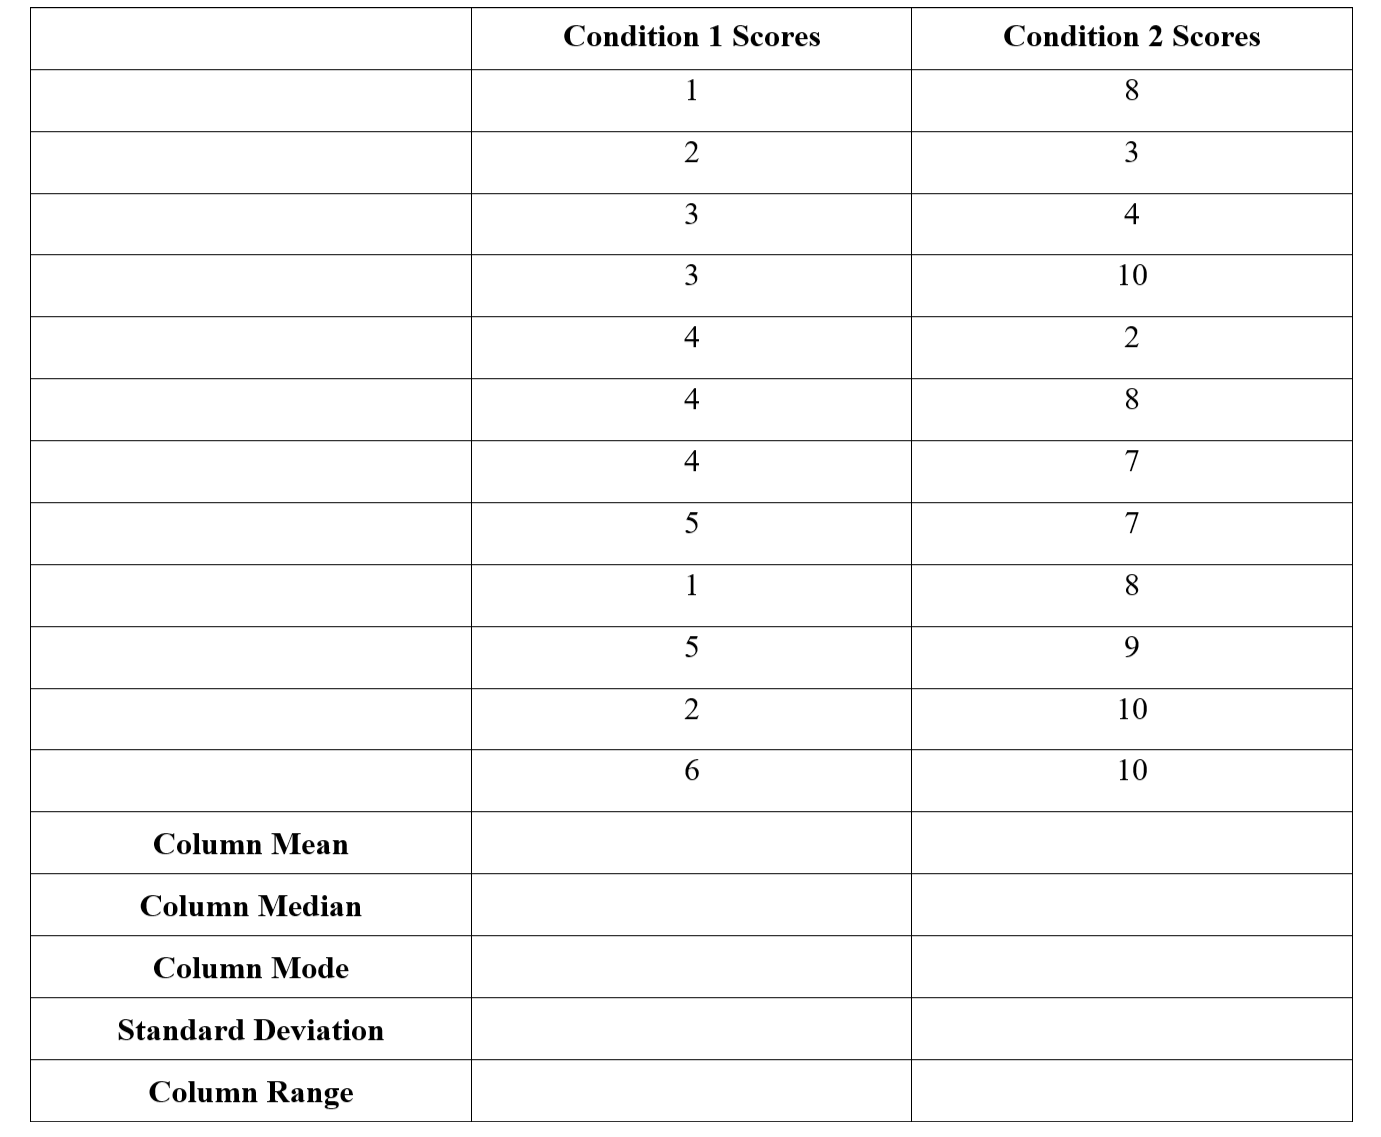
Question: 1. For the table below, fill in the missing sections for the Mean, Median, Mode, Range, and Standard Deviation on your own. Remember to round
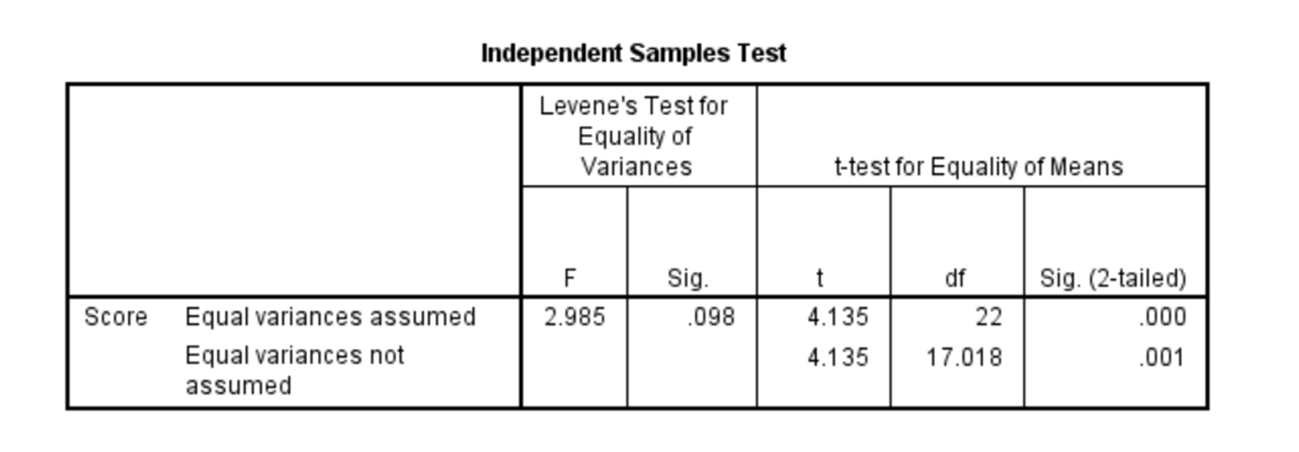
1. For the table below, fill in the missing sections for the Mean, Median, Mode, Range, and Standard Deviation on your own. Remember to round to two decimal places. Hint: Put it in SPSS to simplify the calculation of the standard deviation, using the "Means" test under the Analyze menu! Then complete the five questions and transfer your answers to the quiz in Canvas1. The correct mean for Condition One is _______ while the correct mean for Condition Two is ______: A. 3.50 and 8.00 B. 3.42 and 7.17 C. 4.00 and 8.00 D. 1.51 and 2.76 E. 7.17 and 3.422. The correct standard deviation for Condition One is ________ while the correct standard deviation for Condition Two is _______ A. 3.50 and 8.00 B. 3.42 and 7.17 C. 4.00 and 8.00 D. 1.51 and 2.76 E. 7.17 and 3.423. Which of the following is true about the mode? A. Condition One has one mode while Condition Two has two modes B. Condition Two has one mode while Condition One has two modes C. The mode(s) for Conditions One and Two are different D. The mode(s) for Conditions One and Two are the same3. Imagine you ran a t-Test on this data to see if Condition One differs significantly from Condition Two. You got the following Independent Samples Test table:4. What is the best interpretation for this t-Test? A. It was significant, t(17.02) = 4.14, p .05 B. It was significant, t(22) = 4.14, p .001 C. It was significant, t(22) = 0.00, p .001 D. It was not significant, t(17.02) = 4.14, p > .05 E. It was not significant, t(22) = 4.14, p > .055. Use the Independent Samples Test table as well as your findings for the mean and SDs (from question #1) to determine which of the following is t-Test write-ups correct: A. We ran an independent samples t-Test with score as the dependent variable and condition (1 versus 2) as the independent variable, which was significant, t(17.02) = 4.14, p .05. Scores were higher in condition 1 (M = 3.42, SD = 1.51) than in condition 2 (M = 7.17, SD = 2.76).B. We ran an independent samples t-Test with score as the dependent variable and condition (1 versus 2) as the independent variable, which was significant, t(22) = 4.14, p .001. Scores were higher in condition 1 (M = 3.42, SD = 1.51) than in condition 2 (M = 7.17, SD = 2.76).C. We ran an independent samples t-Test with score as the dependent variable and condition (1 versus 2) as the independent variable, which was significant, t(22) = 4.14, p .001. Scores were lower in condition 1 (M = 3.42, SD = 1.51) than in condition 2 (M = 7.17, SD = 2.76).D. We ran an independent samples t-Test with score as the dependent variable and condition (1 versus 2) as the independent variable, which was not significant, t(17.02) = 4.14, p > .05. Scores did not differ significantly between condition 1 (M = 3.42, SD = 1.51) and condition 2 (M = 7.17, SD = 2.76).E. We ran an independent samples t-Test with score as the dependent variable and condition (1 versus 2) as the independent variable, which was not significant, t(22) = 4.14, p > .05. Scores did not differ significantly between condition 1 (M = 3.42, SD = 1.51) and condition 2 (M = 7.17, SD = 2.76).
\f\f
Step by Step Solution
There are 3 Steps involved in it
1 Expert Approved Answer
Step: 1 Unlock

Question Has Been Solved by an Expert!
Get step-by-step solutions from verified subject matter experts
Step: 2 Unlock
Step: 3 Unlock