

Question: 1. For this question, use the Growth data. This data frame contains data on average growth rates from 1960 to 1995 for 65 countries, along
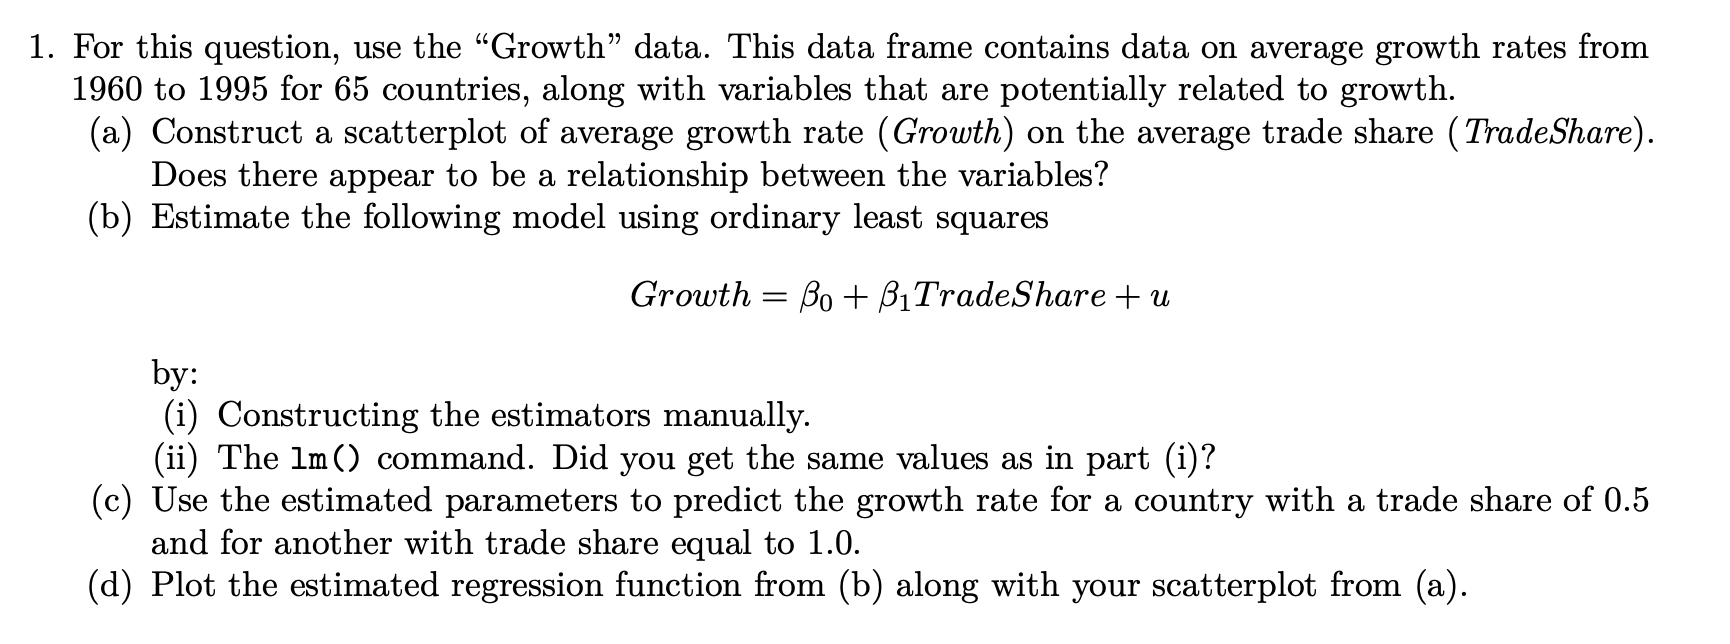
1. For this question, use the Growth data. This data frame contains data on average growth rates from 1960 to 1995 for 65 countries, along with variables that are potentially related to growth. (a) Construct a scatterplot of average growth rate (Growth) on the average trade share (TradeShare). Does there appear to be a relationship between the variables? (b) Estimate the following model using ordinary least squares Growth = Bo + BiTradeShare +u by: (i) Constructing the estimators manually. (ii) The lm () command. Did you get the same values as in part (i)? (c) Use the estimated parameters to predict the growth rate for a country with a trade share of 0.5 and for another with trade share equal to 1.0. (d) Plot the estimated regression function from (b) along with your scatterplot from (a). 1. For this question, use the Growth data. This data frame contains data on average growth rates from 1960 to 1995 for 65 countries, along with variables that are potentially related to growth. (a) Construct a scatterplot of average growth rate (Growth) on the average trade share (TradeShare). Does there appear to be a relationship between the variables? (b) Estimate the following model using ordinary least squares Growth = Bo + BiTradeShare +u by: (i) Constructing the estimators manually. (ii) The lm () command. Did you get the same values as in part (i)? (c) Use the estimated parameters to predict the growth rate for a country with a trade share of 0.5 and for another with trade share equal to 1.0. (d) Plot the estimated regression function from (b) along with your scatterplot from (a)
Step by Step Solution
There are 3 Steps involved in it

Get step-by-step solutions from verified subject matter experts