

Question: 1) Forecast the average December mortgage rate in 2011 using a trend projection, then calculate MAD for this forecast. Next, determine the Durbin-Watson statistic and
1) Forecast the average December mortgage rate in 2011 using a trend projection, then calculate MAD for this forecast. Next, determine the Durbin-Watson statistic and the critical values.
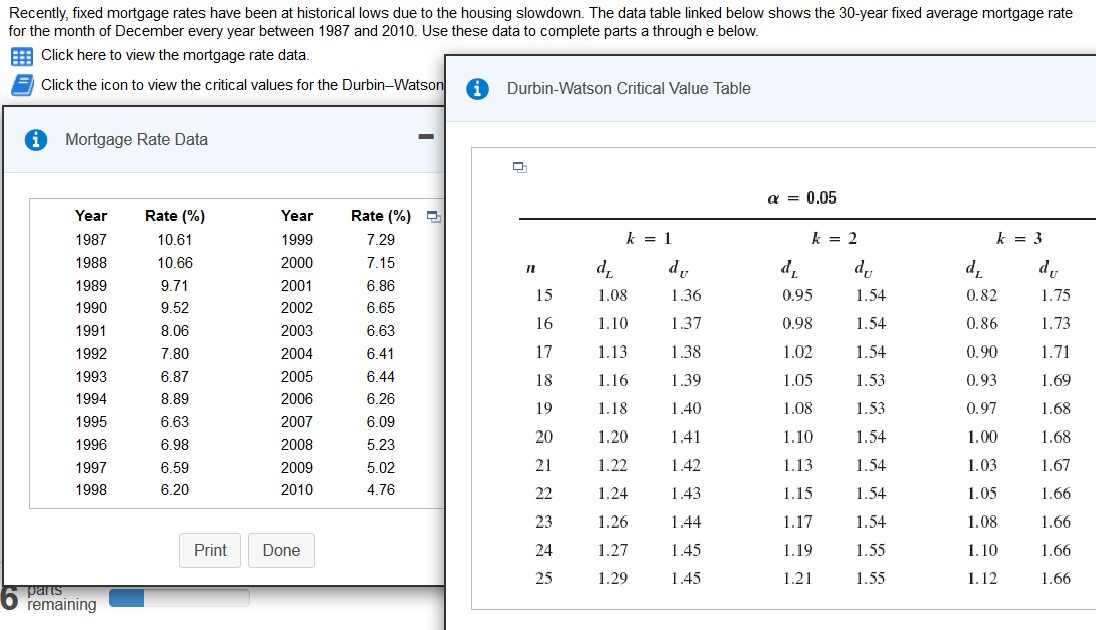
Recently, fixed mortgage rates have been at historical lows due to the housing slowdown. The data table linked below shows the 30-year fixed average mortgage rate for the month of December every year between 1987 and 2010. Use these data to complete parts a through e below. Click here to view the mortgage rate data. Click the icon to view the critical values for the Durbin-Watson A Durbin-Watson Critical Value Table Mortgage Rate Data a = 0.05 Year 1999 2000 Rate (%) e 7.29 7.15 k = 1 k = 2 k = 3 2001 6.86 15 6.65 Year 1987 1988 1989 1990 1991 1992 1993 1994 1995 1996 1997 1998 1.75 1.73 Rate(%) 10.61 10.66 9.71 9.52 8.06 7.80 6.87 8.89 6.63 6.98 6.59 6.20 2002 2003 2004 2005 2006 1.08 1.10 1.13 6.63 6.41 0.95 0.98 1.02 1.05 1.08 1.54 1.54 1.54 1.53 1.53 1.71 6.44 1.16 6.26 1.18 2007 6.09 5.23 1.20 1.36 1.37 1.38 1.39 1.40 1.41 1.42 1.43 1.44 1.45 1.45 1.10 2008 2009 2010 1.54 0.82 0.86 0.90 0.93 0.97 1.00 1.03 1.05 1.08 1.10 1.12 5.02 4.76 1.22 1.24 1.26 1.27 1.29 1.13 1.15 1.17 1.19 1.21 1.54 1.54 1.54 1.55 1.55 1.69 1.68 1.68 1.67 1.66 1.66 1.66 Print Done 1.66 A O parts remaining Recently, fixed mortgage rates have been at historical lows due to the housing slowdown. The data table linked below shows the 30-year fixed average mortgage rate for the month of December every year between 1987 and 2010. Use these data to complete parts a through e below. Click here to view the mortgage rate data. Click the icon to view the critical values for the Durbin-Watson A Durbin-Watson Critical Value Table Mortgage Rate Data a = 0.05 Year 1999 2000 Rate (%) e 7.29 7.15 k = 1 k = 2 k = 3 2001 6.86 15 6.65 Year 1987 1988 1989 1990 1991 1992 1993 1994 1995 1996 1997 1998 1.75 1.73 Rate(%) 10.61 10.66 9.71 9.52 8.06 7.80 6.87 8.89 6.63 6.98 6.59 6.20 2002 2003 2004 2005 2006 1.08 1.10 1.13 6.63 6.41 0.95 0.98 1.02 1.05 1.08 1.54 1.54 1.54 1.53 1.53 1.71 6.44 1.16 6.26 1.18 2007 6.09 5.23 1.20 1.36 1.37 1.38 1.39 1.40 1.41 1.42 1.43 1.44 1.45 1.45 1.10 2008 2009 2010 1.54 0.82 0.86 0.90 0.93 0.97 1.00 1.03 1.05 1.08 1.10 1.12 5.02 4.76 1.22 1.24 1.26 1.27 1.29 1.13 1.15 1.17 1.19 1.21 1.54 1.54 1.54 1.55 1.55 1.69 1.68 1.68 1.67 1.66 1.66 1.66 Print Done 1.66 A O parts remaining
Step by Step Solution
There are 3 Steps involved in it

Get step-by-step solutions from verified subject matter experts