

Question: 1. Form a conclusion about statistical signicance. Do not make any formal calculations. Either use the results provided or make subjective judgments about the results.
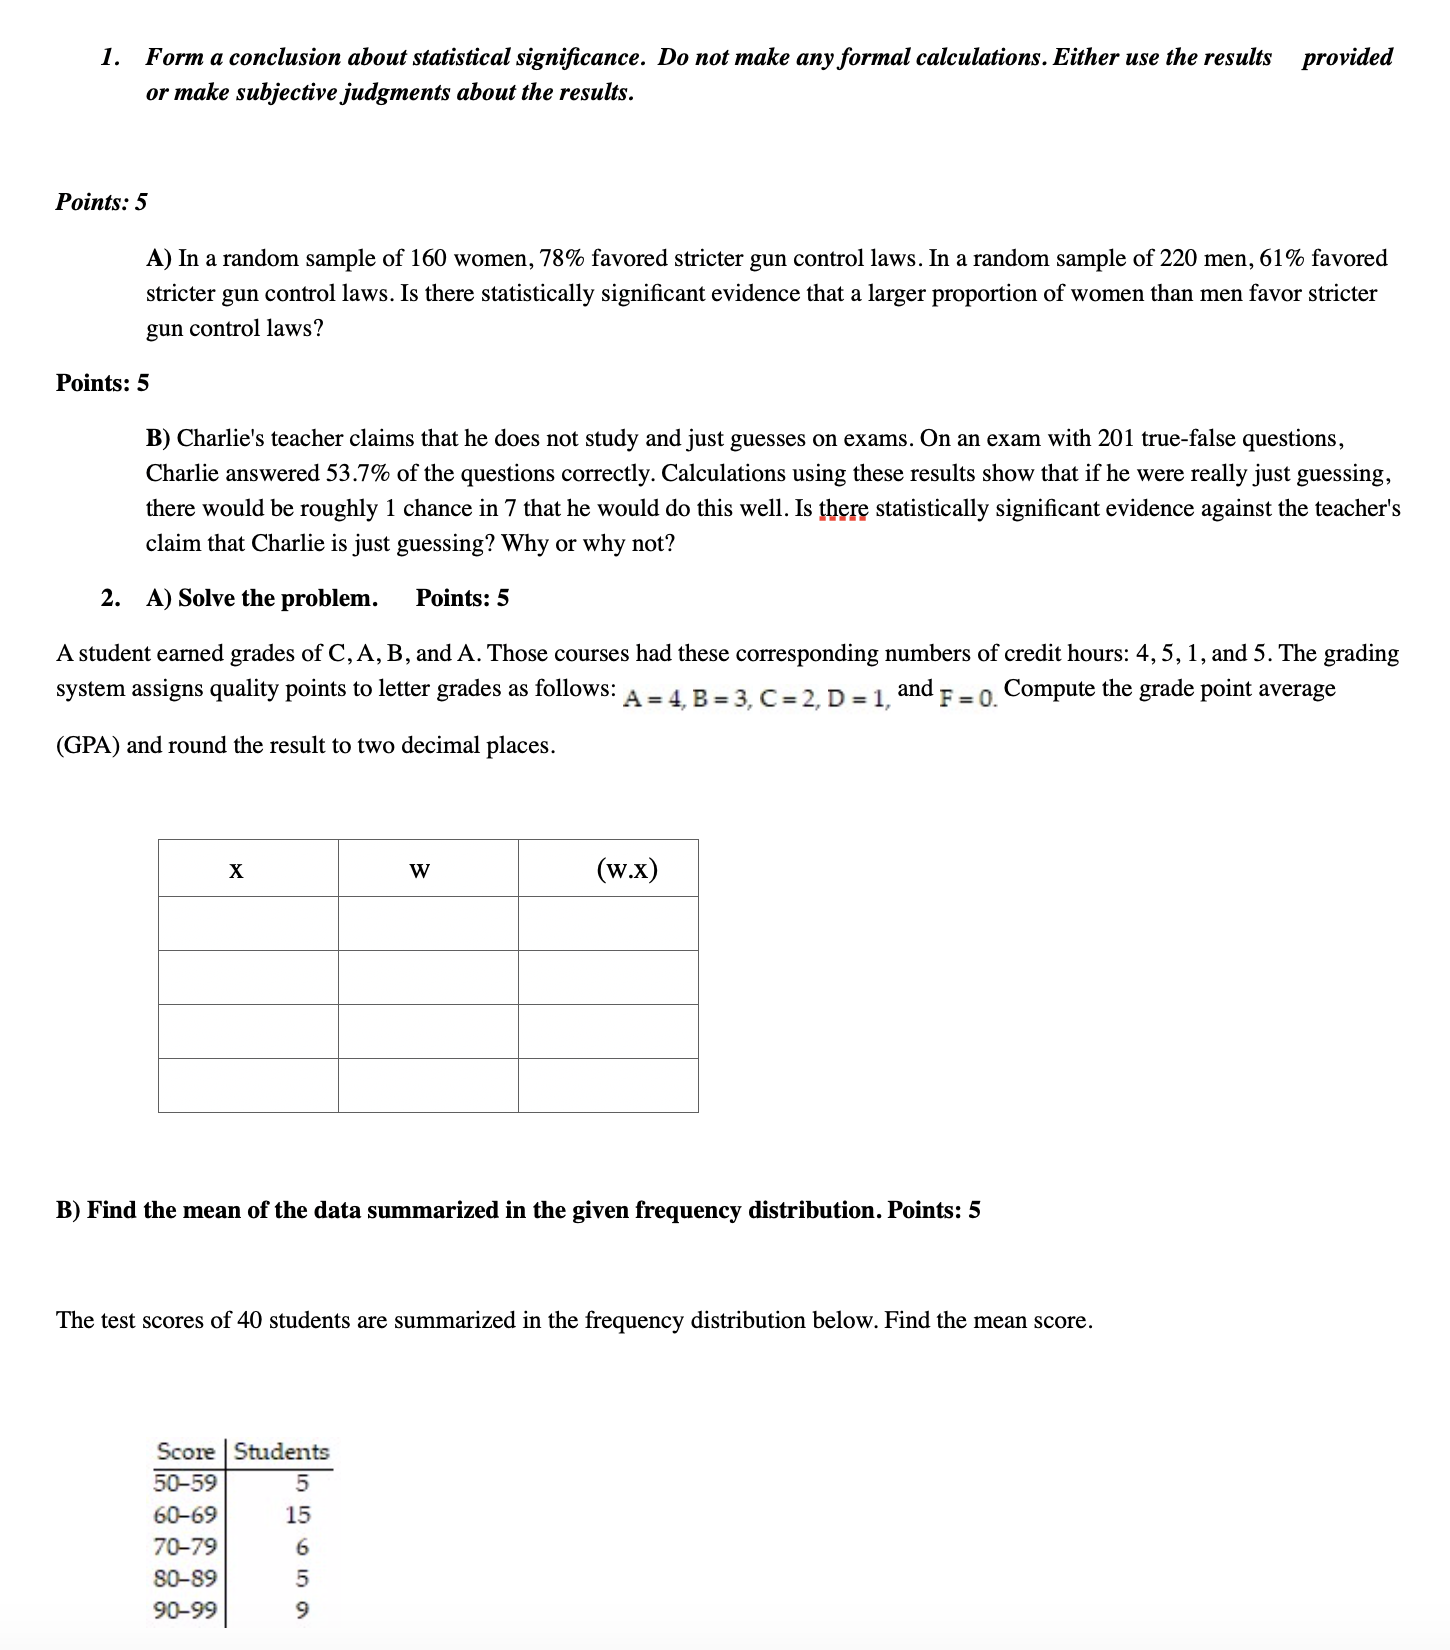
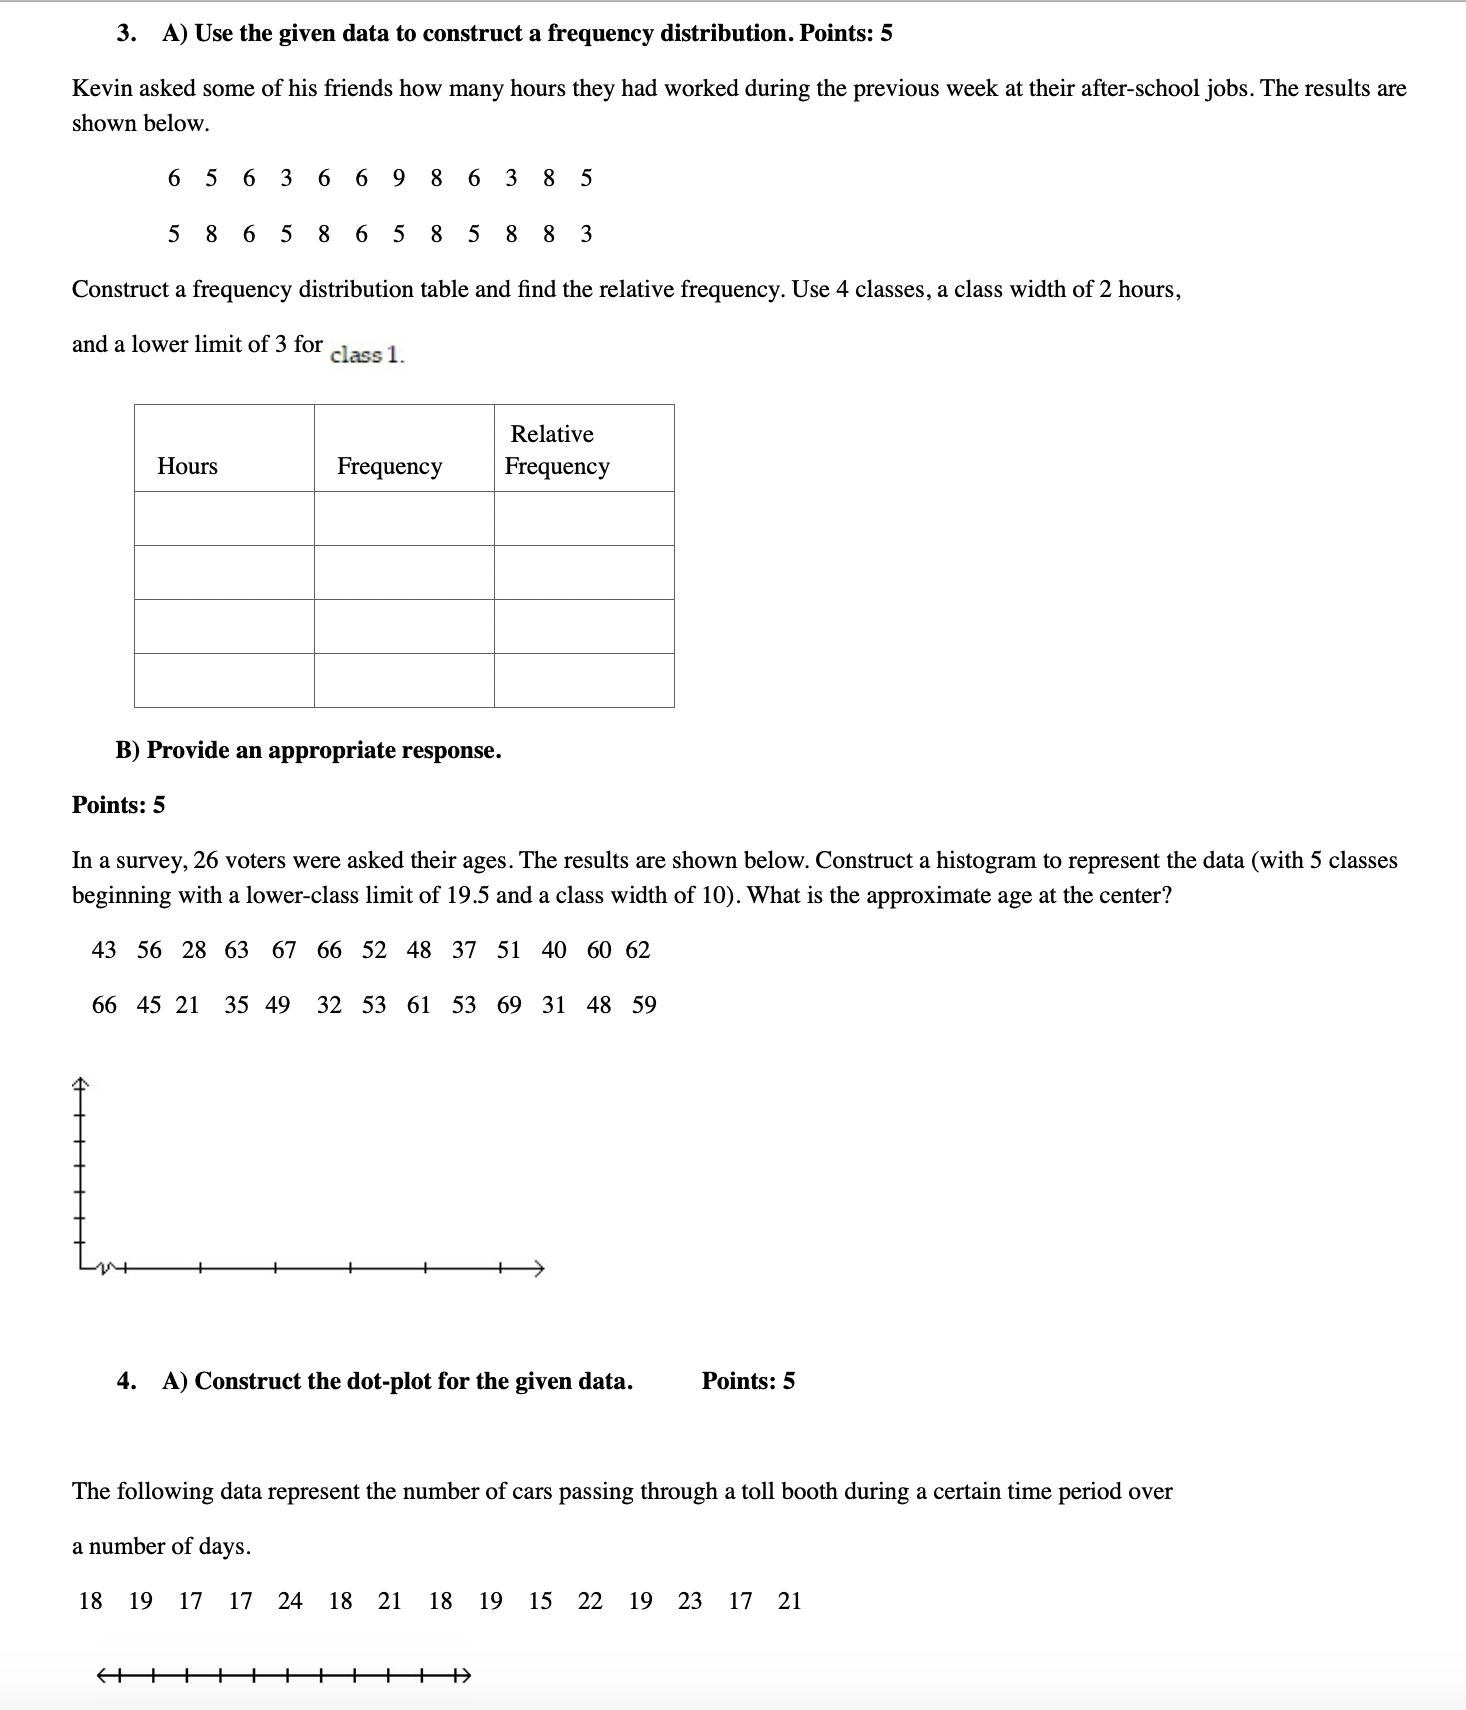
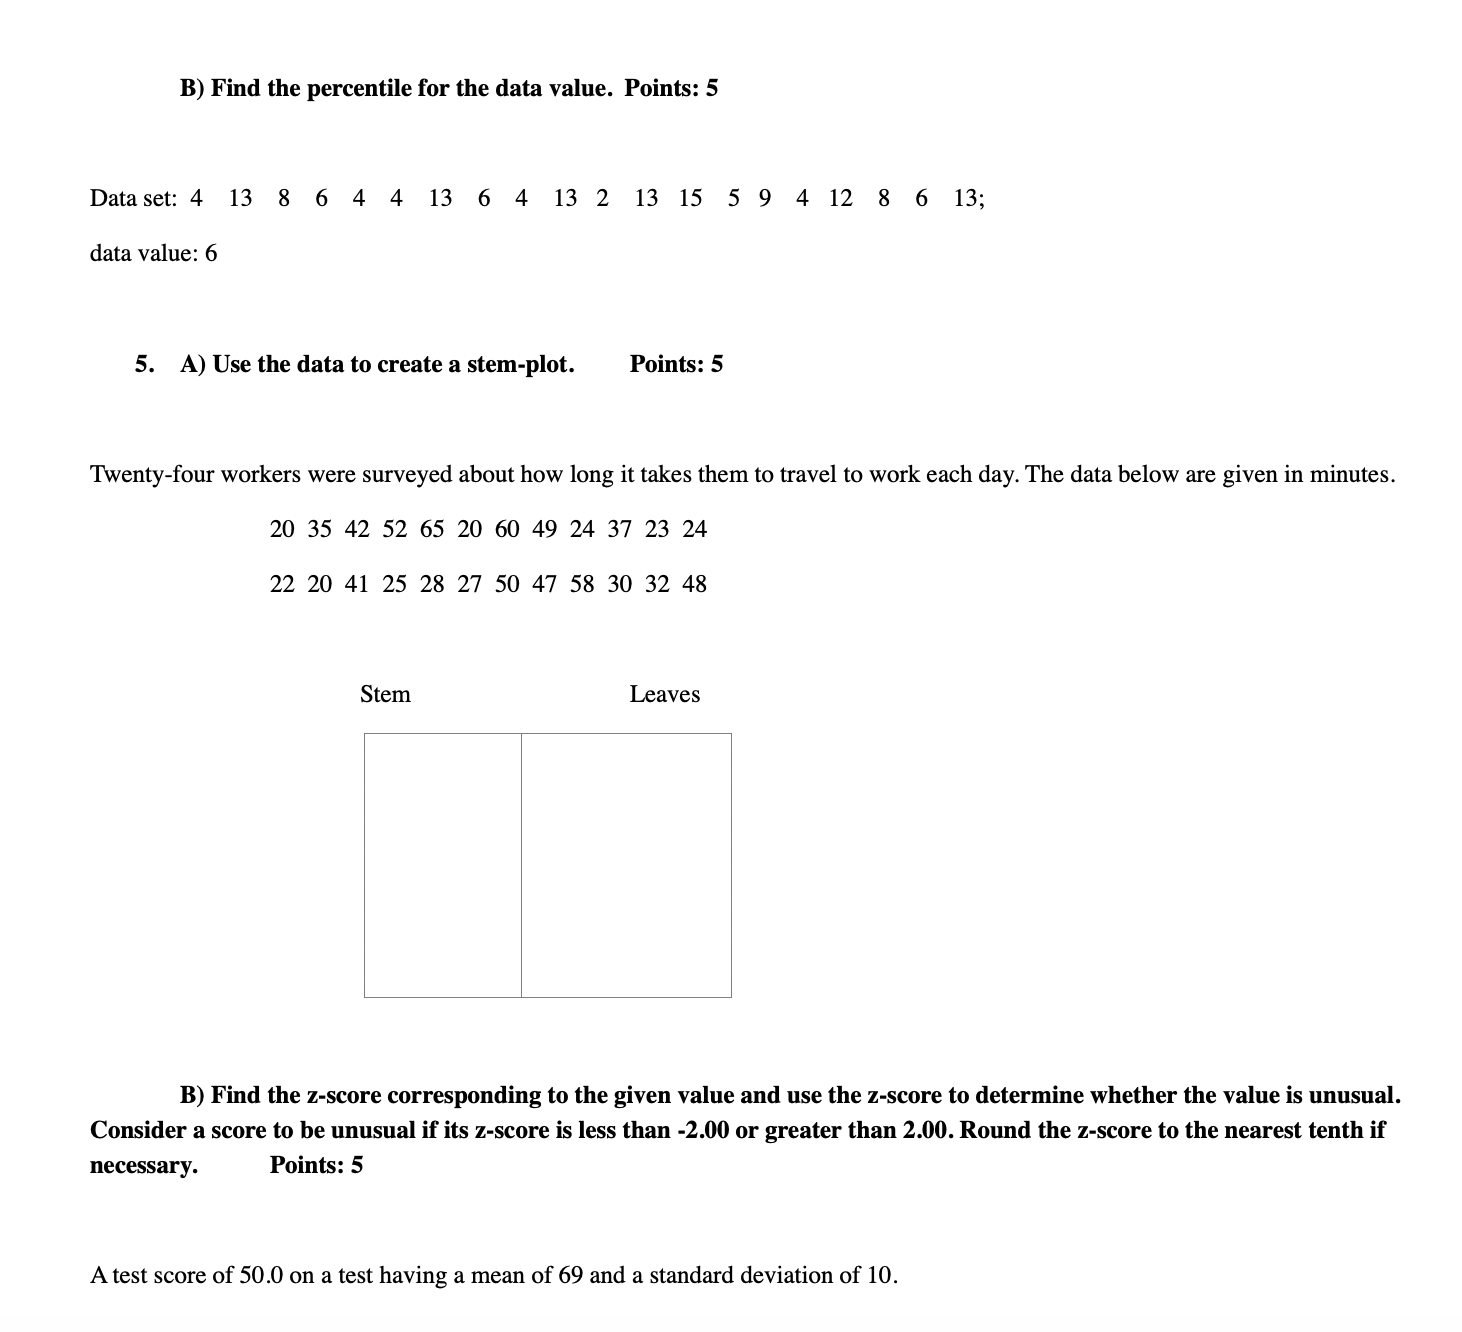
1. Form a conclusion about statistical signicance. Do not make any formal calculations. Either use the results provided or make subjective judgments about the results. Points: 5 A) In a random sample of 160 women, 78% favored stricter gun control laws. In a random sample of 220 men, 61% favored stricter gun control laws. Is there statistically signicant evidence that a larger proportion of women than men favor stricter gun control laws? Points: 5 B) Charlie's teacher claims that he does not study and just guesses on exams. On an exam with 201 true-false questions, Charlie answered 53.7% of the questions correctly. Calculations using these results show that if he were really just guessing, there would be roughly 1 chance in 7 that he would do this well. Is there statistically signicant evidence against the teacher's claim that Charlie is just guessing? Why or why not? 2. A) Solve the problem. Points: 5 A student earned grades of C , A, B, and A. Those courses had these corresponding numbers of credit hours: 4, 5, 1, and 5. The grading system assigns quality points to letter grades as follows: A _ 4' B _ 3 C _ 2 D _ 1 and F _ 0. Compute the grade point average (GPA) and round the result to two decimal places. B) Find the mean of the data summarized in the given frequency distribution. Points: 5 The test scores of 40 students are summarized in the frequency distribution below. Find the mean score. 3. A) Use the given data to construct a frequency distribution. Points: 5 Kevin asked some of his friends how many hours they had worked during the previous week at their after-school jobs. The results are shown below. 6 5 6 3 6 6 9 8 6 3 8 5 5 8 6 5 8 6 5 8 5 8 8 3 Construct a frequency distribution table and nd the relative frequency. Use 4 classes, a class width of 2 hours, and a lower limit of 3 for class 1_ Relative Hours Frequency Frequency B) Provide an appropriate response. Points: 5 In a survey, 26 voters were asked their ages. The results are shown below. Construct a histogram to represent the data (with 5 classes beginning with a lower-class limit of 19.5 and a class width of 10). What is the approximate age at the center? 43 56 28 63 67 66 52 48 37 5140 6062 66 45 21 35 49 32 53 61 53 69 31 48 59 4. A) Construct the dot-plot for the given data. Points: 5 The following data represent the number of cars passing through a toll booth during a certain time period over a number of days. 1819 1717 2418 21181915 22 19 23 17 21 (-llllIlllllB B) Find the percentile for the data value. Points: 5 Dataset:413864413641321315594128613; data value: 6 5. A) Use the data to create a stem-plot. Points: 5 Twenty-four workers were surveyed about how long it takes them to travel to work each day. The data below are given in minutes. 203542526520604924372324 22 20 4125 28 27 50 47 58 30 32 48 Stem Leaves B) Find the z-score corresponding to the given value and use the z-score to determine whether the value is unusual. Consider a score to be unusual if its z-score is less than -2.00 or greater than 2.00. Round the z-score to the nearest tenth if necessary. Points: 5 A test score of 50.0 on a test having a mean of 69 and a stande deviation of 10
Step by Step Solution
There are 3 Steps involved in it

Get step-by-step solutions from verified subject matter experts