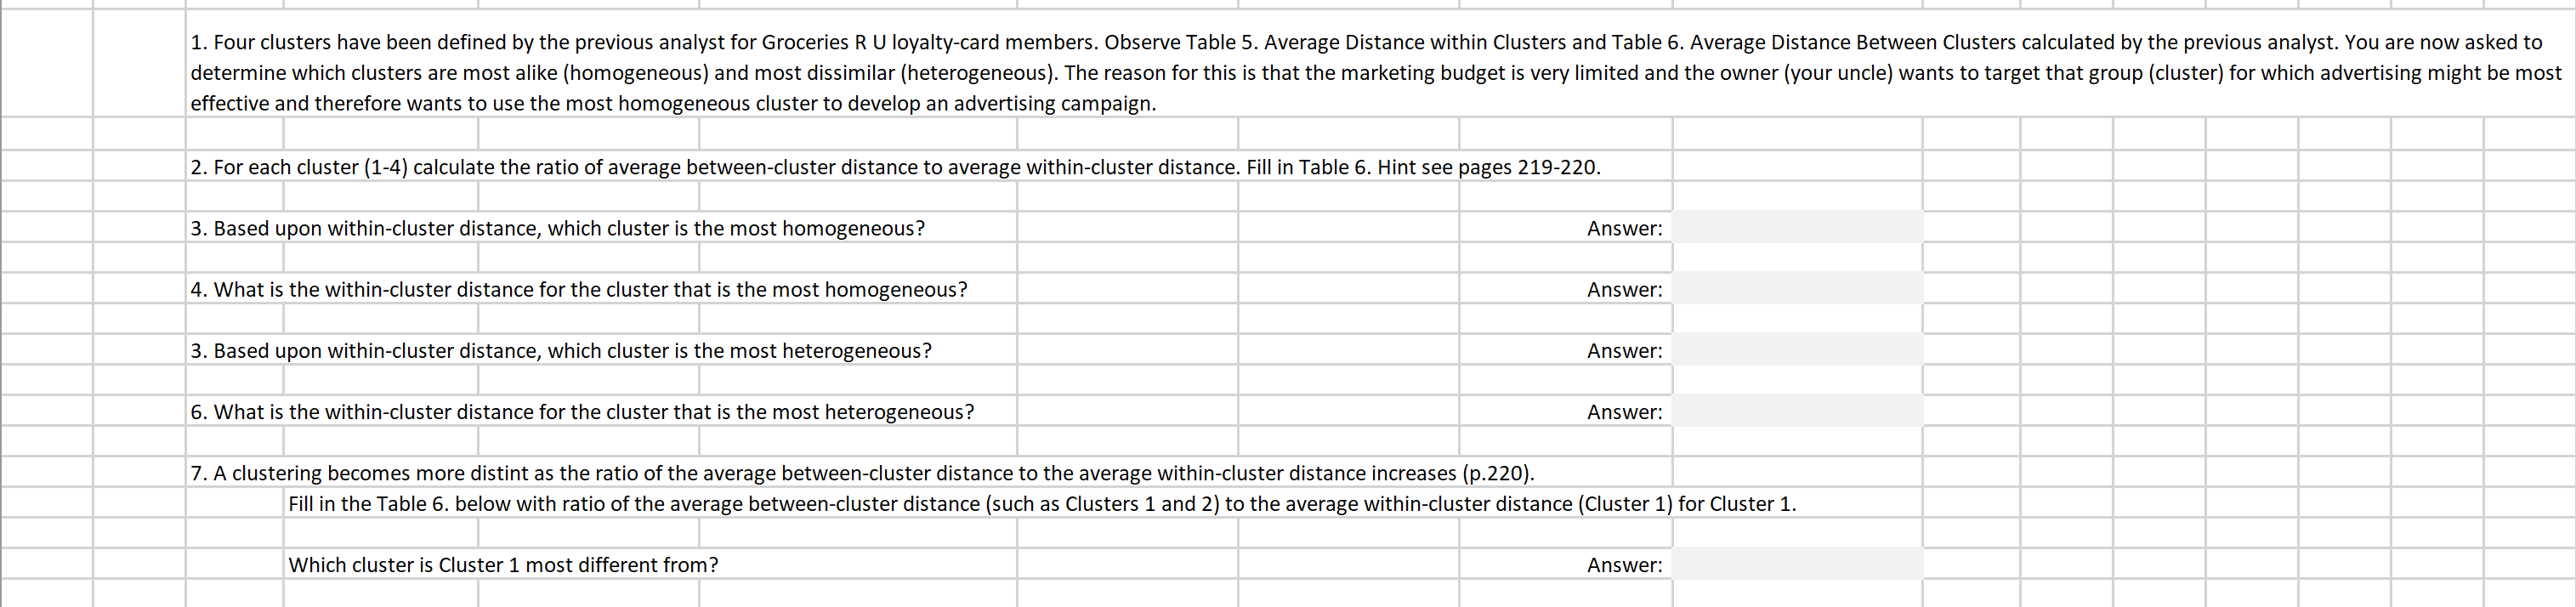
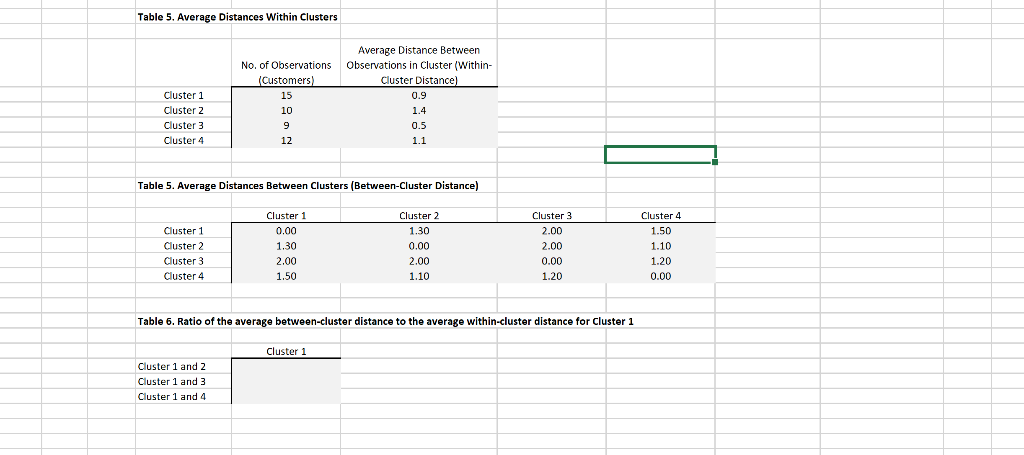
Question: 1. Four clusters have been defined by the previous analyst for Groceries R U loyalty-card members. Observe Table 5. Average Distance within Clusters and Table

1. Four clusters have been defined by the1. Four clusters have been defined by the

1. Four clusters have been defined by the previous analyst for Groceries R U loyalty-card members. Observe Table 5. Average Distance within Clusters and Table 6. Average Distance Between Clusters calculated by the previous analyst. You are now asked to determine which clusters are most alike (homogeneous) and most dissimilar (heterogeneous). The reason for this is that the marketing budget is very limited and the owner (your uncle) wants to target that group (cluster) for which advertising might be most effective and therefore wants to use the most homogeneous cluster to develop an advertising campaign. 2. For each cluster (1-4) calculate the ratio of average between-cluster distance to average within-cluster distance. Fill in Table 6. Hint see pages 219-220. 3. Based upon within-cluster distance, which cluster is the most homogeneous? Answer: 4. What is the within-cluster distance for the cluster that is the most homogeneous? Answer: 3. Based upon within-cluster distance, which cluster is the most heterogeneous? Answer: 6. What is the within-cluster distance for the cluster that is the most heterogeneous? Answer: 7. A clustering becomes more distint as the ratio of the average between-cluster distance to the average within-cluster distance increases (p.220). Fill in the Table 6. below with ratio of the average between-cluster distance (such as Clusters 1 and 2) to the average within-cluster distance (Cluster 1) for Cluster 1. Which cluster is Cluster 1 most different from? Answer: Table 5. Average Distances within Clusters Average Distance Between Observations in Cluster (Within- Cluster Distance) 0.9 No. of Observations (Customers) 15 10 9 Cluster 1 Cluster 2 Cluster 3 Cluster 4 1.4 0.5 1.1 12 Table 5. Average Distances Between Clusters (Between-Cluster Distance) Cluster 1 Cluster 2 Cluster 3 Cluster 4 Cluster 1 0.00 1.30 2.00 1.50 Cluster 2 1.30 0.00 2.00 1.10 Cluster 3 2.00 2.00 0.00 1.20 Cluster 4 1.50 1.10 1.20 0.00 Table 6. Ratio of the average between-cluster distance to the average within-cluster distance for Cluster 1 Cluster 1 Cluster 1 and 2 Cluster 1 and 3 Cluster 1 and 4 1. Four clusters have been defined by the previous analyst for Groceries R U loyalty-card members. Observe Table 5. Average Distance within Clusters and Table 6. Average Distance Between Clusters calculated by the previous analyst. You are now asked to determine which clusters are most alike (homogeneous) and most dissimilar (heterogeneous). The reason for this is that the marketing budget is very limited and the owner (your uncle) wants to target that group (cluster) for which advertising might be most effective and therefore wants to use the most homogeneous cluster to develop an advertising campaign. 2. For each cluster (1-4) calculate the ratio of average between-cluster distance to average within-cluster distance. Fill in Table 6. Hint see pages 219-220. 3. Based upon within-cluster distance, which cluster is the most homogeneous? Answer: 4. What is the within-cluster distance for the cluster that is the most homogeneous? Answer: 3. Based upon within-cluster distance, which cluster is the most heterogeneous? Answer: 6. What is the within-cluster distance for the cluster that is the most heterogeneous? Answer: 7. A clustering becomes more distint as the ratio of the average between-cluster distance to the average within-cluster distance increases (p.220). Fill in the Table 6. below with ratio of the average between-cluster distance (such as Clusters 1 and 2) to the average within-cluster distance (Cluster 1) for Cluster 1. Which cluster is Cluster 1 most different from? Answer: Table 5. Average Distances within Clusters Average Distance Between Observations in Cluster (Within- Cluster Distance) 0.9 No. of Observations (Customers) 15 10 9 Cluster 1 Cluster 2 Cluster 3 Cluster 4 1.4 0.5 1.1 12 Table 5. Average Distances Between Clusters (Between-Cluster Distance) Cluster 1 Cluster 2 Cluster 3 Cluster 4 Cluster 1 0.00 1.30 2.00 1.50 Cluster 2 1.30 0.00 2.00 1.10 Cluster 3 2.00 2.00 0.00 1.20 Cluster 4 1.50 1.10 1.20 0.00 Table 6. Ratio of the average between-cluster distance to the average within-cluster distance for Cluster 1 Cluster 1 Cluster 1 and 2 Cluster 1 and 3 Cluster 1 and 4

Step by Step Solution

There are 3 Steps involved in it

1 Expert Approved Answer
Step: 1 Unlock blur-text-image
Question Has Been Solved by an Expert!

Get step-by-step solutions from verified subject matter experts

Step: 2 Unlock
Step: 3 Unlock

Students Have Also Explored These Related General Management Questions!