

Question: 1. Four plots are presented below. The plot at the top is a distribution for a population; the mean of this distribution is 10 and
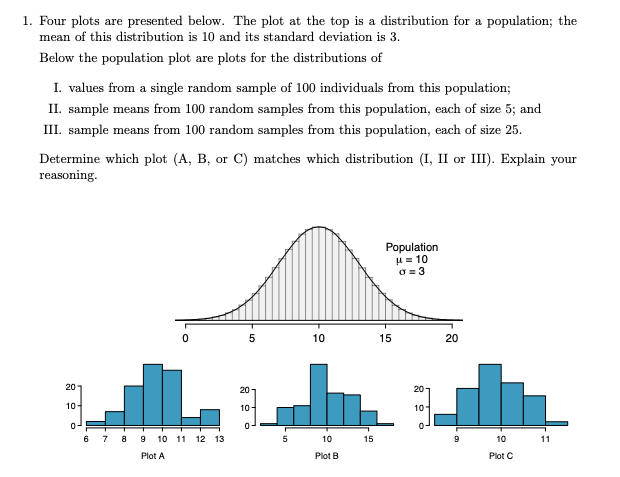
1. Four plots are presented below. The plot at the top is a distribution for a population; the mean of this distribution is 10 and its standard deviation is 3. Below the population plot are plots for the distributions of I. values from a single random sample of 100 individuals from this population; II. sample means from 100 random samples from this population, each of size 5; and III. sample means from 100 random samples from this population, each of size 25. Determine which plot (A, B, or C) matches which distribution (I, II or III). Explain your reasoning. Population H = 10 0=3 o 5 10 15 20 207 20 7 20 10- 10 - 10 6 7 9 10 11 12 13 10 15 10 11 Plot A Plot B Plot C
Step by Step Solution
There are 3 Steps involved in it

Get step-by-step solutions from verified subject matter experts