Question: 1. From a company valuation perspective, how should we include the elements of the ESG analysis in the process? Should we include the elements of
1. From a company valuation perspective, how should we include the elements of the ESG analysis in the process?
Should we include the elements of ESG in the cash flows or in the discount rate, or in both? (Remember at the end we need to arrive to an intrinsic value). Any ideas on how to do it?
2.
Should the financial elements dominate the analysis? Those of ESG? Do they complement each other? How can we better understand the situation? Please provide your perspective on this situation.
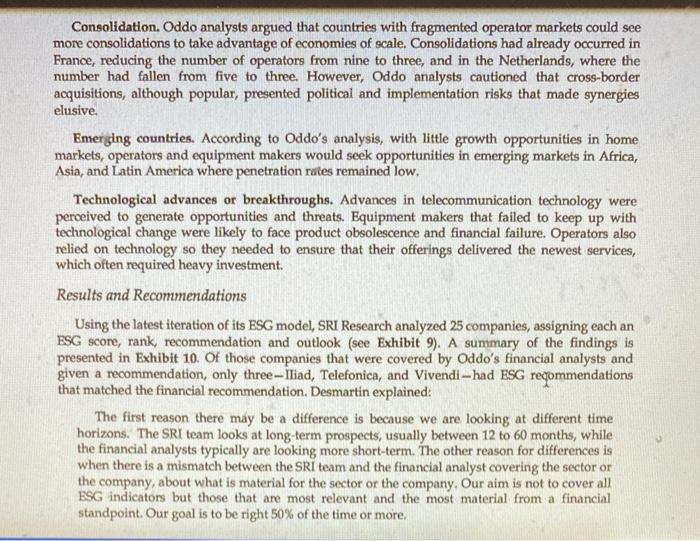
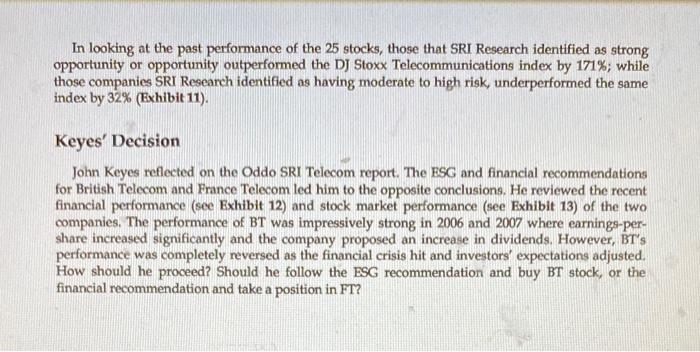
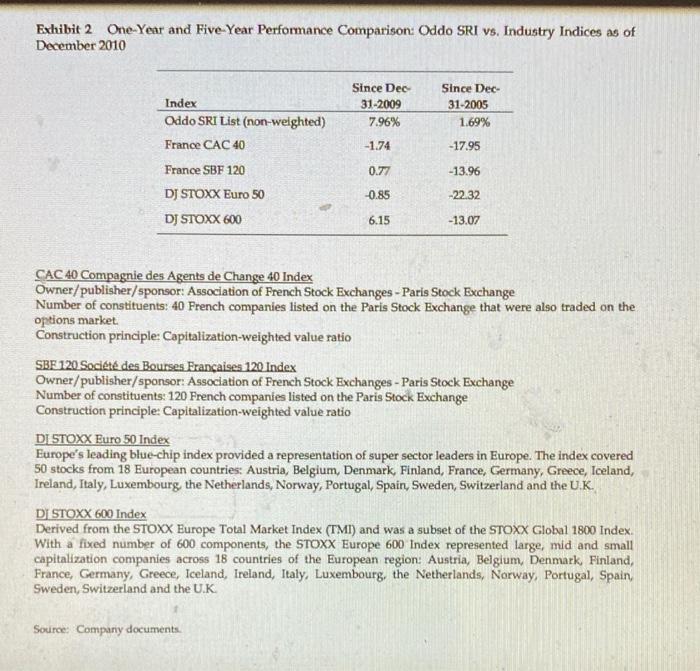
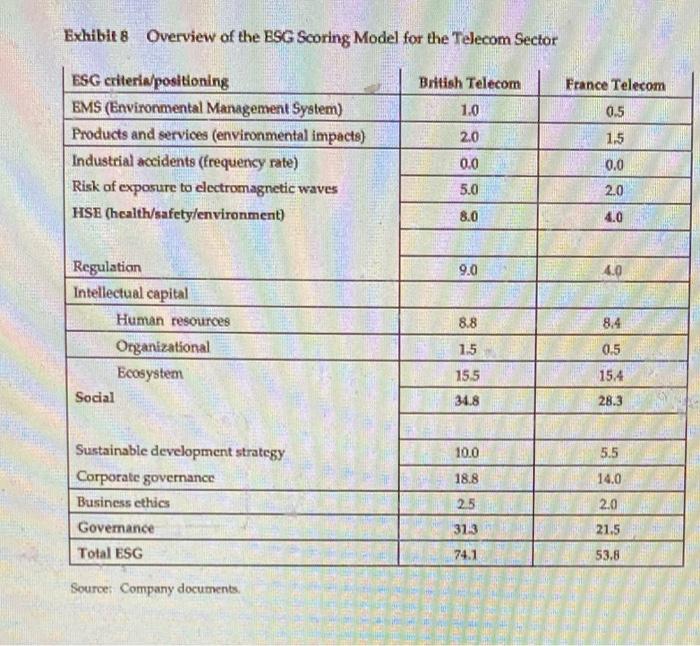
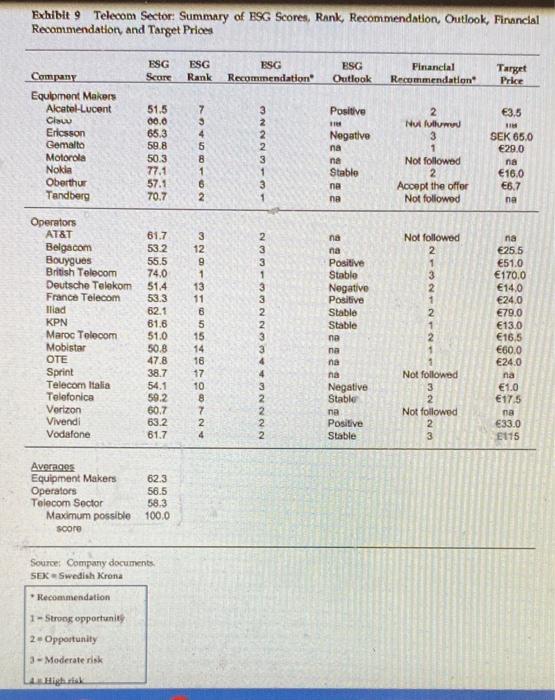
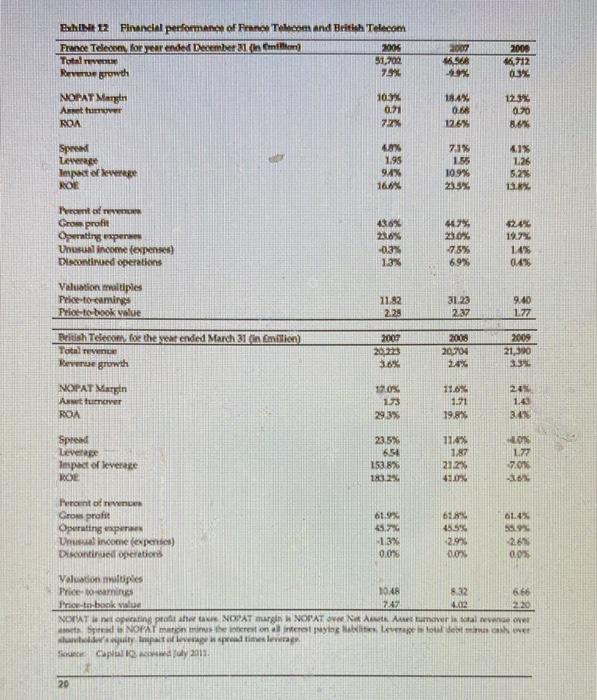
Oddo Securities-ESG Integration In January of 2009, John Keyes, portfolio manager for a medium-sized UK fund, reviewed the analyst report on the telecommunications Industry he had just received from the French brokerage firm Oddo Securities (Oddo). Keyes was intrigued by Oddo's research, which provided two ratings of stocks covered, a financial rating and an environmental social and governance (FSG) rating. Keyes was particularly struck by the returns generated by Oddo's ESG recommendations, which had outperformed most major stocks indices over the last five years. He reviewed the recommendations and analysis for two telecom stocks he was considering adding to his portfolio, British Telecom (BT) and France Telecom (FT). The Oddo analysis assigned BT its highest FSC rating a Strong Opportunity) but rated the company as a "Reduce in the financial recommendation. In contrast, FT was rated as a Moderate Risk under the PSG rating and a "Buy" for the financial rating, Keyes wandered how he should interpret these conflicting ratings, and which deserved more of his attention. Background on Oddo Securities Oddo Securities was owned by Oddo & Cle- an independent investment services firm that in 2010 had 900 employees, office in Paris, Dubai, Madrid, and New York, and over 17 billion in assets under management. The firm was 80% owned by management, employees, and the Oddo family, and 20% by German-based insurer Allianz. It was headed by Philippe Oddo, whose family had been in the stockbroker business for five generations. In addition to its brokerage business, Oddo & Cie owned an investment bank, a financial advisory business, options and commodity businesses, a private bank, and an asset management unit. Oddo Securities was one of France's top brokers. The unit catered to an international institutional clientele providing brokerage services and research on a broad product range, including shares, futures, options and fixed income/credit. The research team, with 60 analysts, economists, and strategists, focused on the French and European market --equities, corporate bonds, and derivatives. Thomas martha 12 capitalization of the France CAC 40 index 89% of the DJ STOXX Furo 50 index and 60% of the DJ STOXX 600 index. ESG Investing and Analysis The use of ESG criteria for investing was a relatively recent innovation in the investment management Industry and fell under the umbrella of socially responsible investing (SRI). SRI strategies could be broadly classified into five categories negative screening positive screening integration, thematic and engagement. Under negative screening companies were excluded from Investment portfolion based on ethical concerns about the safety of their products (eg tobacco, weapons, etc.) and their ethical standards of behavior. Positive screening identified companies with best-in-class ESG performance as Investment candidates. Integration strategies focused on relations between FSG data, ash flows and/or cost of capital, and then embedded those relationships into valuation models. Thematic strategies followed either a molti theme approach focusing on a broad range of long-term environmental or socialines (eg, ageing societies, sustainable nutrition, clean energy, low.income solutions, urbanization, health, sustainable resources) or a hybrid approach combining a large cap "best in class" universe with a thematic overlay. Finally, engagement represented a form of shareholder activism where investors sought to influence how companies addrewed material ESG issues to protect and enhance the value of their investments. SRI investing experienced dramatic growth in the 1995 and 2000s. Between 2001 and 2007 assets under management of socially responsible investors grew by S400 billion in the US, 5600 billion in the UK, and 5400 billion in Canada. In 2007, mutual funds that invested in socially conscious firms had sees under management of more than $2.5 trillion in the United States $2 trillion in Europe S500 billion in Canada, $100 Million in Japan and 564 billion in Australia ESG Analysis at Oddo ESG Analysis at Oddo In June 2005, Oddo hired Jean-Phillippe Desmartin to head its SRI initiative. Desmartin, who had started his career in financial engineering at Credit du Nord, a subsidiary of Societe Generale, and subsequently worked for several social and environmental rating agencies, was charged with developing a systematic methodology for SRI analysis at Oddo. He subsequently hired Sebastien Thevoux-Chabuelas a senior analyst in the initiative. Thevoux-Chabuel had been with Oddo since 2005 as a sell-side analyst on the European Technology sector and he had experience at Deutsche Bank and BFT, a subsidiary of Credit Agricole, sa buy-ide analyst. ESG research at Oddo was divided into three broad areas, Environmental, Social and Governance (Exhibit 1). Environmental factors included environmental management, rinies and opportunities Social factors covered regulatory risks, the management of the firm's human resources, its reputational capital and brands, and its supplier and partner relationships. Governance factors Included the firm's commitment to sustainable development (le using resources to meet human The CAC OwnIndex of 10 traded on the Paris Stock Exchange The Dow Jones STOXX Fure Index represented super sector market des in the 12 luonne countries Austria Belgium, Finland France Germany Greece Ireland Italy, Lembun the Netherlands, Portugal and Spain. The Dow Jones STOXX 600 Index was comprid of 600 Nighly capital and natively traded sisted and traded on wok exchanges from 17 ropean countries The authors Galled these numbers from Information provided by national and intentional organization that track ially conscious fund wichs Hrosil, Social Investment Forum Responsible inwesten Ace Atti Social Response Oration and SRI funde in Asia needs while also preserving the environment), adherence to corporate governance best practices, and business ethics. The Oddo SRI Research team, working in collaboration with the firm's sector analysts, used a multi-step approach to build separate FSG models for each sector. Under the first step, the analyst team assessed which ESG factors were likely to be relevant and material for firms in the sector. Once these constructs were identified, the team developed quantitative and qualitative metrics for each material factor. Finally, the analyst team determined appropriate sector-specific weightings for the metrics, enabling them to be aggregated into separate environmental social and governance performance scores, and into a total FSG score. In explaining how the weightings were created, Desmartin noted that they are intended to reflect the degree to which our ESG performance factors correlate with returns." Weights were estimated using historical relations between the sector's metries/factors and its stock retums. The time horizon over which the historical relations were estimated ranged between 1 and 5 years depending on the availability of data, The BSG analysts at Oddo then used the sector metrics and weightings generated from this process to construct ESG scores for individual companies within the sector. Based on a company's aggregate score, Oddo issued one of four ESG recommendations (Strong Opportunity. Opportunity Moderate Risk, or High Risk) Around 25% of Oddo's non-ESG analysts believed that the firm's ESG research was a useful input into their company research and equity valuations. These analysts typically estimated how the opportunities and risks associated with the ESG scores would affect the future cash flow projections and/or the cost of capital for the companies they covered. Desmartin observed that the best financial analysts are most eager to use ESG research in their analysis and recommendations. The analysts who have the best reputation in the market are always trying to find ways to innovate and stay ahead of the curve." He added at 10% of financial analysts are skeptical about the value of FSG research." Theroux. Chabuel explained that these analysts are reluctant to incorporate ESG factors into their valuation models because they do not fully understand ESG analysis and do not have control over the analysis. ddo's ESG approach was designed to provide investors with insights into a firm's management ilities, identify its key risks and opportunities, and drivers of its long term sustainable financial 3 d CSG Integration 100% Around 25% of Oddo's non-ESG analysts believed that the firm's ESG research was a useful input into their company research and equity valuations. These analysts typically estimated how the opportunities and risks associated with the ESG scores would affect the future cash flow projections and/or the cost of capital for the companies they covered. Desmartin observed that "the best financial analysts are most eager to use ESG research in their analysis and recommendations. The analysis who have the best reputation in the market are always trying to find ways to innovate and stay ahead of the curve." He added that 10% of financial analysts are skeptical about the value of ESG research." Thevoux Chabuel explained that these analysts "are reluctant to incorporate PSG factors into their valuation models because they do not fully understand ESG analysis and do not have control over the analysis." Oddo's ESG approach was designed to provide investors with insights into a firm's management capabilities, identify its key risks and opportunities, and drivers of its long-term sustainable financial performance. The goal of the ESG analysis, therefore, was to allow clients to optimize the ratio of returns to risk. Desmartin explained the firm's approach and the type of clients it sought to attract: In practice we are very far from some of the ethical approaches used in the US. We do not exclude companies, we do not exclude activities, and we do not say what is good and what is bad. Ours is not a religious or moral approach. We simply want to find the best investment opportunities for our clients in the long-term. ... We want 80% of our SRI research business to come from mainstream investors, not explicitly socially-conscious investors. Already, 50% of our business is coming from mainstream investors, SRI research was targeted to large institutional investors with long-term time horizons such as pension funds and insurance companies. However, Desmartin observed "we have seen some recent interest in SRI from hedge funds. I would not say it is a trend, yet it is very interesting because their focus is exclusively on making money." Oddo's ESG recommendations reflected the expected performance of each stock over a long-term horizon (ie, beyond 12 months). As reported in Exhibit 2 the stocks included in Oddo's SRI Strong Opportunity portfolio hud outperformed the market for both the five-year and one-year horizons. addo Securities-ESG Integration 4 / 21 100% Oddo calculated that from 2005 to 2010, its Strong Opportunity portfolio beat market indices by between 1,476 and 2,401 basis points (bps), depending on the index. For 2010, the portfolio beat the market by 181 to 970 bps, again depending on the index. Oddo's Telecom Sector Report Oddo's study of the telecom sector covered major equipment makers and service providers in the US and Europe ESG Model Desmartin and Thevoux-Chabuel created a model to evaluate and score telecommunication companies based on the three ESG factors. The environmental factor was labeled Health, Safety and Environment and covered whether the firm had an environmental management system, the environmental impact of telecom products and services, and the safety of products and services. Social factors included regulatory risks and opportunities, and intellectual capital (reflecting customer relationships and branding, human resource management, and supplier and partner relationships). Governance covered commitment to a sustainable development strategy, corporate governance, and business ethics. For each of these factors, Oddo analysts identified lower level quantitative and qualitative metries. The weights assigned to each of these factors are shown in Exhibit 3. For operators, intellectual capital accounted for 40% and governance for 38% of ESG I scoring Health/safety/environment (HSE) Oddo analysts rated HSE factors as less important for the telecom sector than other sectors (e.g, energy, transportation, etc.). Telecom companies contributed less than 1% of CO2 emissions, and telecom products and services could lower transportation demand, paper consumption, etc. The principal HSE risk identified was exposure to potential electromagnetic waves, which insurance companies were hesitant to cover. Risk exposure to electromagnetic waves was driven by exposure to mobile communications (80%) and by prevention measures (20%) Social Factors Fortelor customer relationships and branding, human resource management, and supplier and partner relationships). Governance covered commitment to a sustainable development strategy, corporate governance, and business ethics. For each of these factors, Oddo analysts identified lower level quantitative and qualitative metrics. The weights assigned to each of these factors are shown in Exhibit 3. For operators, intellectual capital accounted for 40% and governance for 38% of ESG scoring Health/safety/environment (HSE) Oddo analysts rated HSE factors as less important for the telecom sector than other sectors (e.g., energy, transportation, etc.). Telecom companies contributed less than 1% of CO2 emissions, and telecom products and services could lower transportation demand, paper consumption, etc. The principal HSE risk identified was exposure to potential electromagnetic waves, which insurance companies were hesitant to cover. Risk exposure to electromagnetic waves was driven by exposure to mobile communications (80%) and by prevention measures (20%). Social Factors For telecom operators, the most important social factors identified were regulatory risks, and intellectual capital generated from the management of human resources and customer, supplier, and partner relationships (termed social ecosystem). On the human resources side the Oddo analysis attempted to identify companies characterized by a workforce that was productive and economically efficient but at the same time paid well. On the social ecosystem side the analysts assessed the innovation capacity, brand value, supply chain efficiency, the quality, durability, growth potential and diversification of distribution networks, product and service quality, and customer satisfaction. The criteria used to generate scores for human resource and social ecosystem factors are I shown in Exhibits 4 and 5. Governance The sustainable development and corporate governance criteria used in the ESG model are shown in Exhibits 6 and 7. The sustainable development criteria distinguished between companies that factored corporate social responsibility (CSR) and sustainable development into their internal and external communications and those that integrated CSR and sustainable development into their strategies and business models. The weightings used for corporate governance criteria differed for large-cap and mid to small sized firms, for firms with a controlling interest and for those with diversified owners, and for family-owned businesses. Exhibit 8 shows the scores that BT and FT received by Oddo analysts in each of the factors. BT scored higher by more than 20 points and outperformed FT in all three categories. Industry Drivers Oddo's SRI analysis of the telecom industry identified five long-term performance drivers: sustainable development, regulation, sector consolidation, emerging countries, and technological advances or breakthroughs. Sustainable Development. The analysts rated the sector highly for sustainable development, primarily because they assessed that it was well-positioned to create dematerialized growth (defined as making more products using fewer resources), facilitate entrepreneurial activities, open new markets, and help other organizations and industries become more sustainable. Regulation. Because the telecom operator sector was viewed as a natural monopoly, it had been subject to regulation. Oddo analysts perceived this to be a key industry risk, particularly for many European telecom operators as regulators focused on increasing competition to lower prices and offer more services options for retail consumers. Consolidation. Oddo analysts argued that countries with fragmented operator markets could see more consolidations to take advantage of economies of scale. Consolidations had already occurred in France, reducing the number of operators from nine to three, and in the Netherlands, where the number had fallen from five to three. However, Oddo analysts cautioned that cross-border acquisitions, although popular, presented political and implementation risks that made synergies elusive. Emerging countries. According to Oddo's analysis, with little growth opportunities in home markets, operators and equipment makers would seek opportunities in emerging markets in Africa, Asia, and Latin America where penetration rates remained low. Technological advances or breakthroughs. Advances in telecommunication technology were perceived to generate opportunities and threats. Equipment makers that failed to keep up with Consolidation. Oddo analysts argued that countries with fragmented operator markets could see more consolidations to take advantage of economies of scale. Consolidations had already occurred in France, reducing the number of operators from nine to three, and in the Netherlands, where the number had fallen from five to three. However, Oddo analysts cautioned that cross-border acquisitions, although popular, presented political and implementation risks that made synergies elusive, Emerging countries. According to Oddo's analysis, with little growth opportunities in home markets, operators and equipment makers would seek opportunities in emerging markets in Africa, Asia, and Latin America where penetration rates remained low. Technological advances or breakthroughs. Advances in telecommunication technology were perceived to generate opportunities and threats. Equipment makers that failed to keep up with technological change were likely to face product obsolescence and financial failure. Operators also relied on technology so they needed to ensure that their offerings delivered the newest services, which often required heavy investment Results and Recommendations Using the latest iteration of its ESG model, SRI Research analyzed 25 companies, assigning each an ESG score, rank, recommendation and outlook (see Exhibit 9). A summary of the findings is presented in Exhibit 10. Of those companies that were covered by Oddo's financial analysts and given a recommendation, only three - Iliad, Telefonica, and Vivendi -- had ESG reqommendations that matched the financial recommendation. Desmartin explained: The first reason there may be a difference is because we are looking at different time horizons. The SRI team looks at long-term prospects, usually between 12 to 60 months, while the financial analysts typically are looking more short-term. The other reason for differences is when there is a mismatch between the SRI team and the financial analyst covering the sector or the company, about what is material for the sector or the company. Our aim is not to cover all ESG indicators but those that are most relevant and the most material from a financial standpoint. Our goal is to be right 50% of the time or more, In looking at the past performance of the 25 stocks, those that SRI Research identified as strong opportunity or opportunity outperformed the DJ Stoxx Telecommunications index by 171%; while those companies SRI Research identified as having moderate to high risk, underperformed the same index by 32% (Exhibit 11). Keyes' Decision John Keyes reflected on the Oddo SRI Telecom report. The ESG and financial recommendations for British Telecom and France Telecom led him to the opposite conclusions. He reviewed the recent financial performance (see Exhibit 12) and stock market performance (see Exhibit 13) of the two companies. The performance of BT was impressively strong in 2006 and 2007 where earnings-per- share increased significantly and the company proposed an increase in dividends. However, BT's performance was completely reversed as the financial crisis hit and investors' expectations adjusted. How should he proceed? Should he follow the ESG recommendation and buy BT stock, or the financial recommendation and take a position in FT? Exhibiti Integrating ESG into valuation models ESG Research Materiality Measurement Vahation Model L O N Environment Management Risks Opportunities 6 Business Model ESG KPI'S Opportunities 1 Performance T E Social Regulation IC - Human Capital IC - License to Operate/Reputation IC - Ecosystem, Quality, non-compleance R M Management ESG Events Cash flow Cost of Capital Risk Premium D R I V Volatility 1 Governance Sustainable development strategy Corporate Governance Business Ethics Statements Monetary Value Risks E R S Source: Company documents. Note: "Management"refers to "Margement quality. "Statements" refers to "Financial statements" "10" in "Intellectual Capital" Exhibit 2 One-Year and Five-Year Performance Comparison: Oddo SRI vs Industry Indices as of December 2010 Index Oddo SRI List (non-weighted) France CAC 40 Since Dec 31-2009 7.96% Since Dec 31-2005 1.69% -1.74 - 17.95 France SBF 120 0.77 -13.96 DJ STOXX Euro 50 -0.85 -22.32 DJ STOXX 600 6.15 -13.07 CAC 40 Compagnie des Agents de Change 40 Index Owner/publisher/sponsor: Association of French Stock Exchanges - Paris Stock Exchange Number of constituents: 40 French companies listed on the Paris Stock Exchange that were also traded on the options market Construction principle: Capitalization-weighted value ratio SBF 120 Socit des Bourses Franaises 120 Index Owner/publisher/sponsor: Association of French Stock Exchanges - Paris Stock Exchange Number of constituents: 120 French companies listed on the Paris Stock Exchange Construction principle: Capitalization-weighted value ratio DJ STOXX Euro 50 Index Europe's leading blue-chip index provided a representation of super sector leaders in Europe. The index covered 50 stocks from 18 European countries: Austria, Belgium, Denmark Finland, France, Germany, Greece, Iceland, Ireland, Italy, Luxembourg, the Netherlands, Norway, Portugal, Spain, Sweden, Switzerland and the U.K. DJ STOXX 600 Index Derived from the STOXX Europe Total Market Index (TMI) and was a subset of the STOXX Global 1800 Index. With a fixed number of 600 components, the STOXX Europe 600 Index represented large, mid and small capitalization companies across 18 countries of the European region: Austria, Belgium, Denmark, Finland, France, Germany, Greece, Iceland, Ireland, Italy, Luxembourg, the Netherlands, Norway, Portugal, Spain, Sweden, Switzerland and the U.K. Source: Company documents. Oddo Securitier-ESG Integration Exhibit 3 Overview of the ESG Scoring Model for the Telecom Sector Operators ESG criteria/positioning EMS (Environmental Management System) Products and services (environmental impacts) Industrial accidents (frequency rate) Risk of exposure to electromagnetic waves HSE (health/safety/environment) Equipment Makers 3% 6 2 5 16 1% 2 0 1 14 15 Regulation Intellectual capital Human resources Organizational Ecosystem Social 1 29 15 2 23 46 54 10 25 10 25 Sustainable development strategy Corporate governance Business ethics Governance 3 3 38 38 Total ESG 100% 100% Source: Company documents Exhibit 4 Human Resources Indicators and Criteria for the Telecom Sector Indicator Criteria Nature of Criterion Weighting 10% Governance and HR profile Growth model Quantitative & qualitative Quantitative & qualitative 0 4 Qualitative 2 Quantitative & qualitative Attractiveness and recruitment 5 Quantitative 4 Quantitative 2 2 Ago pyramid management HR representation on executive Board HR transparency Size-related attractiveness Intomational presence-related attractiveness Economic attractiveness Average wage costs Employee share of ownership Growth In headcount Integration, annual review rate, career planning Training quality and effectiveness Management of Teorganizational restructuring measures Departure arrival of kay personnel Staff tumover Quantitative Quantitative Quantitative 5 Career integration and planning 2 Quantitative 4 Quantitative & qualitative 2 Motivation and satisfaction Quantitative & qualitative Mainly Qualitative 10 5 Qualitative 3 Quantitative Absenteeism 3 Quantitative 10 Mainly Qualitative Operational HR management 2 Quantitative 5 Workplace climate and dialogue Payroll management Quality of local management Operating margin per employee Social liabilis (pension funds, healthcare class actions) Qualitative 5 Quantitative 9 Quantitative Total 100% Exhibit5 Ecosystem Criteria for the Telecom Sector Equipment Maker 4,0% Operators 2.0% 4.0 11.0 Nature of Criteria Qualitative Quantitative & qualitative Quantitative & qualitativo Qualitative 2.0 3.0 Citeria Corporate culture, Internal organization Innovation R&D/patents Brand Supply chain, logistics, industrial partnerships Distribution network Product and service quality Customer satisfaction Total 4.0 2.0 2.0 5.0 3.0 3.0 Qualitative Quantitative & qualitative Quantitativa & qualitative 3.0 4.0 29.0% 23.0% Source Company documents. Exhibit 6 Sustainable Development Strategy Criteria for the Telecom Sector Equipment Makers 1.0% Operators 1.0% Nature of Criteria Quantitative & qualitative 1.0 1.0 Qualitative Criteria Length of sustainable development track record and learning curve Sustainable development organization: Direct reporting: Director profile Resources allocated: Interactions across functions Sustainable development Information systems Products and services with sustainable development added value Sustainable development objectives and results 2.0 2.0 Quantitative & qualitative 3.0 3.0 Quantitative & qualitative 3.0 30 Quantitative & qualitative Total 10.0% 10.0% Source: Company documents Exhibit7 Corporate Governance Criteria for the Telecom Sector Mid-Small Cap Criteria Large Cap Non- Controlled Controlled 17% 12% Non- Controlled Family owned Controlled 18% 11% 12% 13 10 13 10 5 2 10 2 10 13 10 10 15 15 20 3 3 3 3 1. Minority shareholder rights (1 share - 1 vote; anti- takeover measures) 2. Separation of functions (CEO-Chalman) 3. Separation of roles (executives/shareholders/ board members) 4. Executive succession planning 6 Transparency and cohesion of executive pay 6. Assessment of executive pay and long-term performance 7. Board effectiveness (composition, functioning) 8. Committees reporting to the board 9. Audit processes; degree of accountability, legal and tax transparency and complexity 10. Quality of financial communication Total 5 5 5 20 20 20 21 16 5 5 13 13 9 9 12 12 11 11 12 100% 100% 100% 100% 100% Source: Company documents Exhibit 8 Overview of the ESG Scoring Model for the Telecom Sector British Telecom France Telecom 0.5 1.0 2.0 1,5 ESG criteria positioning EMS (Environmental Management System) Products and services (environmental impacts) Industrial accidents (frequency rate) Risk of exposure to clectromagnetic waves HSE (health/safety/environment) 0.0 0.0 5.0 2.0 8.0 4.0 9.0 4.0 8.8 8.4 Regulation Intellectual capital Human resources Organizational Ecosystem Social 1.5 0.5 15.5 15.4 34.8 28.3 10.0 5.5 18.8 14.0 Sustainable development strategy Corporate governance Business ethics Governance Total ESG 25 2.0 31.3 21.5 74.1 53.8 Source Company documents Exhibit 9 Telecom Sector: Summary of ESG Scores, Rank, Recommendation, Outlook, Financial Recommendation and Target Prices ESG Score ESG Rank Company ESG Recommendation ESG Outlook Pinancial Recommendation" Target Price 7 2 Nulluluww 3.5 Equipment Makers Alcatel-Lucent Claw Ericsson Gemalto Motorola Nokia Oberthur Tandberg 51.5 00.0 65.3 59.8 50.3 77.1 57.1 70.7 4 5 8 1 Positive 11 Negative na na Stable NA Not followed 2 Accept the offor Not followed SEK 65,0 29.0 na 16.0 6.7 na Not followed 2 Operators AT&T Belgacom Bouygues British Telecom Deutsche Telekom France Telecom 1 13 11 lad 1 2 KPN Maroc Telecom Mobistar OTE Sprint Telecom Italia Telefonice Verizon Vivendi Vodafone 61.7 53.2 55.5 74.0 51.4 53.3 62.1 81.6 51.0 50.8 47.8 38.7 54.1 59.2 60.7 63.2 5 15 14 16 17 10 8 7 2 4 NNNN GUNNLAGAN na na Positive Stablo Negative Positive Stable Stable na na na na Negative Stable na Positive Slable na 25.5 51.0 170.0 14,0 24.0 79.0 13.0 16,5 60.0 24.0 na 1.0 17.5 na 33.0 E115 Not followed Not followed 61.7 Averages Equipment Makers 62.3 Operators 56.5 Telecom Sector 58.3 Maximum possible 100.0 score Souter Company documents SEK Swedish Krona Recommendation 1 - Strong opportunity 2. Opportunity 3- Moderate risk As High Bhitt 12 Financial performance of France Telecom and British Telecom Frice Telecom for year ended December 31 2005 Totalrevent 51,702 Prve growth 7.5% 4.568 9.9% 2000 46,712 0.3% NOPAT Martin Arnette ROA 103% 071 72 18.4% 0.86 12.6% 123% 0.70 8.6% 7.1% 155 Speed Lewe Impact of love ROE 1.95 94% 166% 41% 1.26 5.2% 13. 19.9% 23.5% Pront of Grow profit Operating exper Unusual income expenses) Discontinued operations 13.6% 238% -0.3% 1.3% 46.7% 23.0% 75% 6.9% 2.4% 19.7% 14% 0.4% Valuation multiples Price-toeaming Price to book value 11.82 228 31.23 237 9:40 177 2009 British Telecom for the year ended March 31 (in Emillion) Total TV Revenue growth 2007 20:23 30% 20,704 2.4% 2009 21,30 3.34 NOPAT Margin Artturnever ROA 17.0% 133 29.3% 11.6% 1.91 19.8% 2.4% 1.4 BAN Spread Leverage Imphet of leverage RO 23.5% 654 153.8% 123.2% 114% 1.87 21.2% 41.03 LO 177 701 Pront of Grow profit Operating pers Unusual income expenses) Discontinued operations 61.9% 45 13% 0.0% 6989 4559 2.9% 0.05 61.4% 559 265 0.0% Valuation natoples Price 046 832 6.66 Protobank valud 7:47 4.02 NOUT Operating patit us NOCAT margin HNOPATOVA Arttumawer is tales or SNOPAT Screst online nyingi ng todo w ya spel Scapa Yay 2011 20