

Question: 1. From the following data, construct an expenditure 4. (More schedule on a piece of graph paper. Then use the consum Income-expenditure (45 Hue) diagram
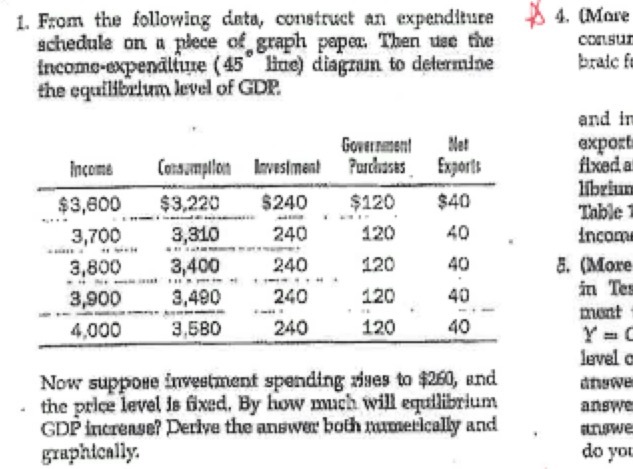
1. From the following data, construct an expenditure 4. (More schedule on a piece of graph paper. Then use the consum Income-expenditure (45 Hue) diagram to determine brate f the equilibrium level of GDP. and in Government Met export Income Consumption Investment Purchases Exports fixed a $3,600 $3.220 $240 $120 librium $40 Table 3,700 3,310 240 120 40 Incom 3,800 3,400 240 120 40 8. (More 3,900 3,490 240 120 40 in Te mont 4.000 3.580 240 120 40 Y=C level o Now suppose investment spending rises to $260, and angwe . the price level is fixed. By how much will equilibrium angwe GDP increase? Derive the answer both numerically and graphically. do you
Step by Step Solution
There are 3 Steps involved in it

Get step-by-step solutions from verified subject matter experts