

Question: 1. From the graph in Fig. L5a answer the following questions. (a) Which curve represents y = y(t)? How do you know? (b) What is
1. From the graph in Fig. L5a answer the following questions.
(a) Which curve represents y = y(t)? How do you know?
(b) What is the period of the motion? Answer this question first graphically (by reading the
period from the graph) and then analytically (by finding the period using ?0).
(c) We say that the mass comes to rest if, after a certain time, the position of the mass remains within an arbitrary small distance from the equilibrium position. Will the mass ever come to rest? Why?
(d) What is the amplitude of the oscillations for y?
(e) What is the maximum velocity (in magnitude) attained by the mass, and when is it attained? Make sure you give all the t-values at which the velocity is maximum and the corresponding maximum value. The t-values can be determined by magnifying the MATLAB figure using the magnify button , and by using the periodicity of the velocity function.
(f) How does the size of the mass m and the stiffness k of the spring affect the motion? Support your answer first with a theoretical analysis on how ?0 and therefore the period of the oscillation is related to m and k, and then graphically by running LAB05ex1.m first with m = 5 and k = 4 and then with m = 1 and k = 16. Include the corresponding graphs.
La
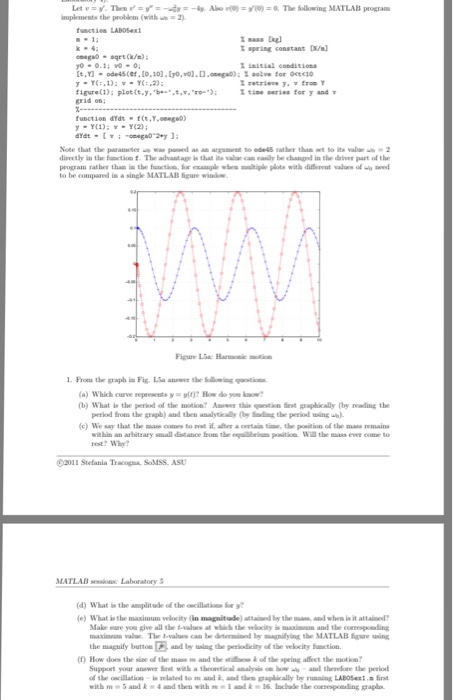
Let v = y?. Then v? = y?? = ??0^2y = ?4y. Also v(0) = y?(0) = 0. The following MATLAB program implements the problem (with ?0 = 2).
function LAB05ex1 m = 1; k = 4; omega0 = sqrt(k/m); y0 = 0.1; v0 = 0; [t,Y] = ode45(@f,[0,10],[y0,v0],[],omega0); % solve for 0Note that the parameter ?0 was passed as an argument to ode45 rather than set to its value ?0 = 2 directly in the function f. The advantage is that its value can easily be changed in the driver part of the program rather than in the function, for example when multiple plots with different values of ?0 need to be compared in a single MATLAB figure window.
Need help with #1 a-f
From the graph in Fig. L5a answer the following questions. Which curve represents y=y(t)? How do you know
Step by Step Solution
There are 3 Steps involved in it

Get step-by-step solutions from verified subject matter experts