

Question: 1. Fuel demand in OECD countries: Create two scatter plots showing the relationship between fuelcon and fuelprice and between fuelcon and gdppc. Briefly describe what
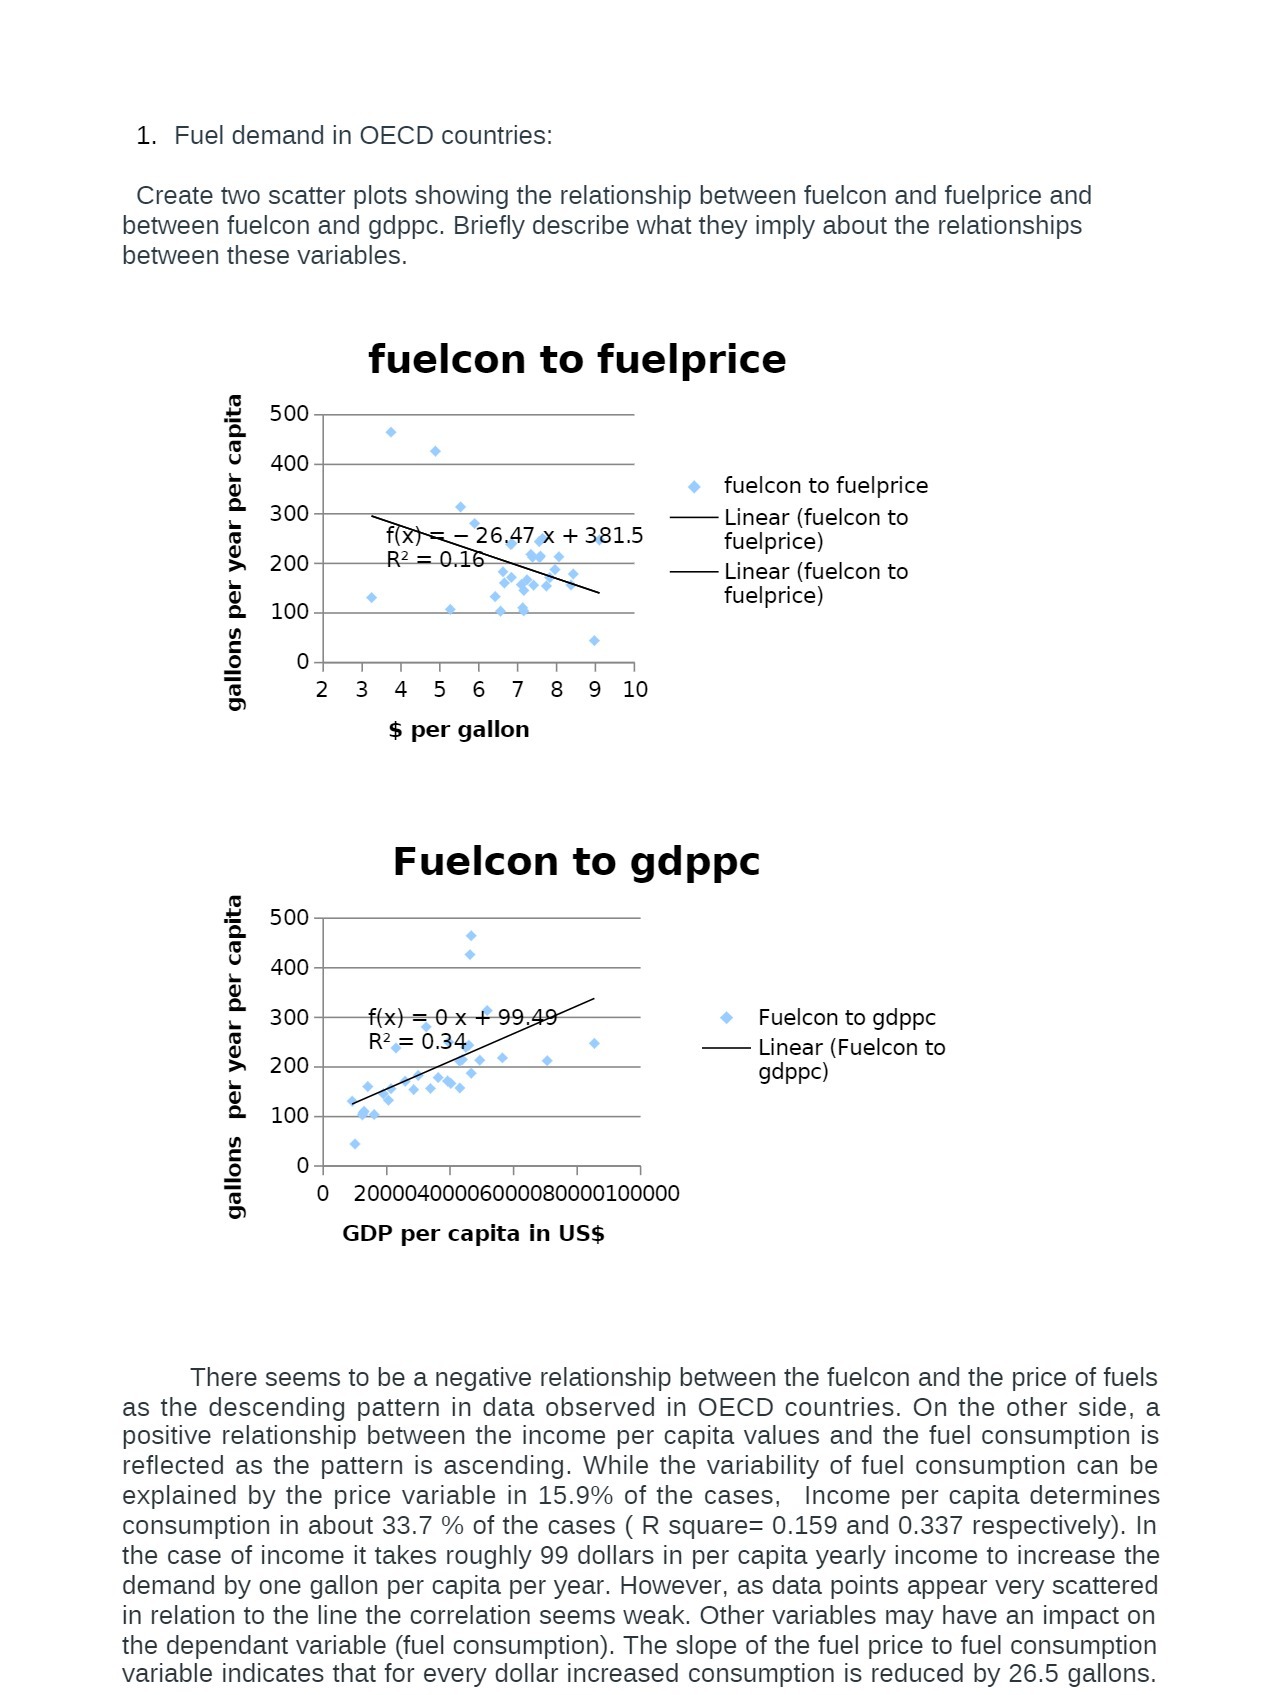

1. Fuel demand in OECD countries: Create two scatter plots showing the relationship between fuelcon and fuelprice and between fuelcon and gdppc. Briefly describe what they imply about the relationships between these variables. fuelcon to fuelprice 500 400 fuelcon to fuelprice 300 Linear (fuelcon to f(X)=- 26.47 x + 381.5 fuelprice) gallons per year per capita 200 R2 = 0.16 Linear (fuelcon to fuelprice) 100 2 3 4 5 6 7 8 9 10 $ per gallon Fuelcon to gappc 500 400 300 f (x) = 0x + 99.49 Fuelcon to gappc R2 = 0.34 Linear (Fuelcon to gallons per year per capita 200 gappc) 100 0 20000400006000080000100000 GDP per capita in US$ There seems to be a negative relationship between the fuelcon and the price of fuels as the descending pattern in data observed in OECD countries. On the other side, a positive relationship between the income per capita values and the fuel consumption is reflected as the pattern is ascending. While the variability of fuel consumption can be explained by the price variable in 15.9% of the cases, Income per capita determines consumption in about 33.7 % of the cases ( R square= 0.159 and 0.337 respectively). In the case of income it takes roughly 99 dollars in per capita yearly income to increase the demand by one gallon per capita per year. However, as data points appear very scattered in relation to the line the correlation seems weak. Other variables may have an impact on the dependant variable (fuel consumption). The slope of the fuel price to fuel consumption variable indicates that for every dollar increased consumption is reduced by 26.5 gallons
Step by Step Solution
There are 3 Steps involved in it

Get step-by-step solutions from verified subject matter experts