

Question: 1. Generate a histogram of 20,000 randomly generated integer floating-point numbers according to a normal distribution with a user-specified mean and standard deviation. Your
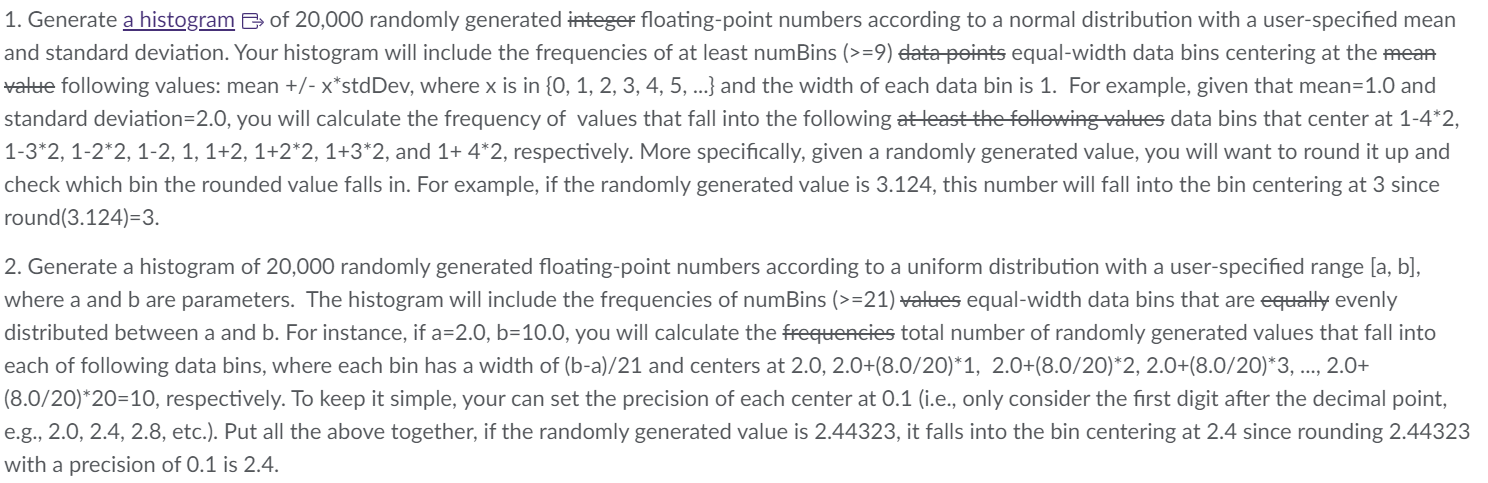

1. Generate a histogram of 20,000 randomly generated integer floating-point numbers according to a normal distribution with a user-specified mean and standard deviation. Your histogram will include the frequencies of at least numBins (>=9) data points equal-width data bins centering at the mean value following values: mean +/- x*stdDev, where x is in {0, 1, 2, 3, 4, 5, ...} and the width of each data bin is 1. For example, given that mean=1.0 and standard deviation=2.0, you will calculate the frequency of values that fall into the following at least the following values data bins that center at 1-4*2, 1-3*2, 1-2*2, 1-2, 1, 1+2, 1+2*2, 1+3*2, and 1+ 4*2, respectively. More specifically, given a randomly generated value, you will want to round it up and check which bin the rounded value falls in. For example, if the randomly generated value is 3.124, this number will fall into the bin centering at 3 since round(3.124)=3. 2. Generate a histogram of 20,000 randomly generated floating-point numbers according to a uniform distribution with a user-specified range [a, b], where a and b are parameters. The histogram will include the frequencies of numBins (>=21) values equal-width data bins that are equally evenly distributed between a and b. For instance, if a=2.0, b=10.0, you will calculate the frequencies total number of randomly generated values that fall into each of following data bins, where each bin has a width of (b-a)/21 and centers at 2.0, 2.0+(8.0/20)*1, 2.0+(8.0/20)*2, 2.0+(8.0/20)*3, ..., 2.0+ (8.0/20)*20=10, respectively. To keep it simple, your can set the precision of each center at 0.1 (i.e., only consider the first digit after the decimal point, e.g., 2.0, 2.4, 2.8, etc.). Put all the above together, if the randomly generated value is 2.44323, it falls into the bin centering at 2.4 since rounding 2.44323 with a precision of 0.1 is 2.4. Please follow the problem solving process and submit the following steps in one set of documents as a group: Algorithm design and description in pseudo code Implement your algorithms in one CPP file: one free-standing function per problem. Feel free to include separate files if your group chooses to do so. o when choosing data structures, consider std::array, std::pair, and std::vector. o what's your function prototype? Test your CPP implementation using some input examples
Step by Step Solution
There are 3 Steps involved in it
Given the provided task an example approach for the two histogram generation problems using C can be described as follows 1 Histogram of Normally Distributed Random Numbers Algorithm in pseudo code fu... View full answer

Get step-by-step solutions from verified subject matter experts