

Question: 1. Given the following data: $begin{array}{111lll}text { 1. } & text { Giventhe following data: } & & mathrm{X} & 5 & 10 & 15
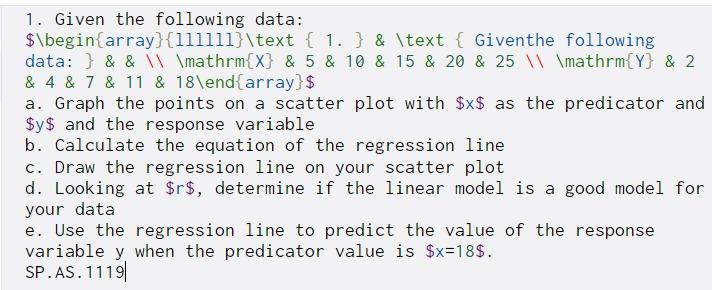
1. Given the following data: $\begin{array}{111lll}\text { 1. } & \text { Giventhe following data: } & & \mathrm{X} & 5 & 10 & 15 & 20 & 25 \\mathrm{Y} & 2 & 4 & 7 & 11 & 18\end{array} $ a. Graph the points on a scatter plot with $x$ as the predicator and $y$ and the response variable b. Calculate the equation of the regression line c. Draw the regression line on your scatter plot d. Looking at $r$, determine if the linear model is a good model for your data e. Use the regression line to predict the value of the response variable y when the predicator value is $x=18$. SP.AS. 1119 1. Given the following data: $\begin{array}{111lll}\text { 1. } & \text { Giventhe following data: } & & \mathrm{X} & 5 & 10 & 15 & 20 & 25 \\mathrm{Y} & 2 & 4 & 7 & 11 & 18\end{array} $ a. Graph the points on a scatter plot with $x$ as the predicator and $y$ and the response variable b. Calculate the equation of the regression line c. Draw the regression line on your scatter plot d. Looking at $r$, determine if the linear model is a good model for your data e. Use the regression line to predict the value of the response variable y when the predicator value is $x=18$. SP.AS. 1119
Step by Step Solution
There are 3 Steps involved in it

Get step-by-step solutions from verified subject matter experts