

Question: 1) Given the following GPS observations and control station coordinates to accompany the figure below, what are the most probable coordinates for stations B and
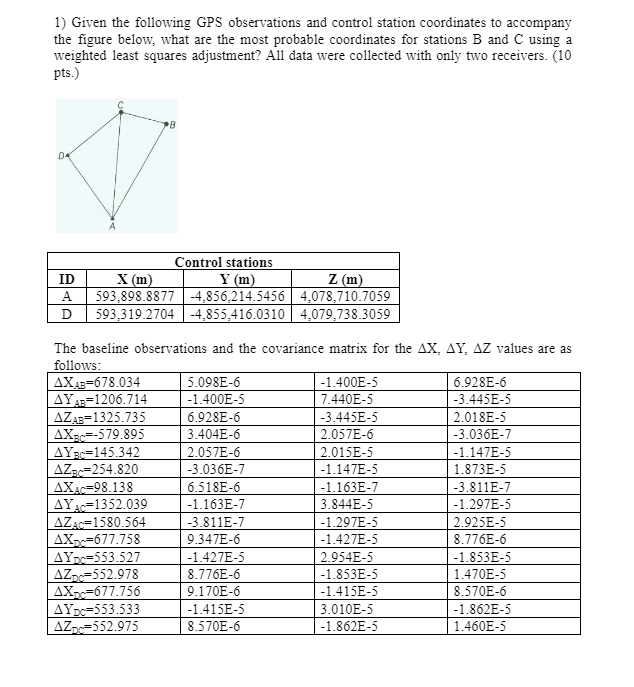
1) Given the following GPS observations and control station coordinates to accompany the figure below, what are the most probable coordinates for stations B and C using a weighted least squares adjustment? All data were collected with only two receivers. (10 pts.) Control stations ID X (m) Y (m) Z (m) A 593,898.8877 -4,856,214.5456 4,078,710.7059 D 593.319.2704 -4.855.416.0310 4.079,738.3059 The baseline observations and the covariance matrix for the AX, AY, AZ values are as follows: AXAE=678.034 5.098E-6 -1.400E-5 6.928E-6 AYAD=1206.714 -1.400E-5 7.440E-5 -3.445E-5 AZAB=1325.735 6.928E-6 -3.445E-5 2.018E-5 AX= =-579.895 3.404E-6 2.057E-6 -3.036E-7 AYBC=145.342 2.057E-6 2.015E-5 -1.147E-5 AZ= =254.820 -3.036E-7 -1.147E-5 1.873E-5 AXC=98.138 6.518E-6 -1.163E-7 -3.811E-7 AY=1352.039 -1.163E-7 3.844E-5 -1.297E-5 AZAC=1580.564 -3.811E-7 -1.297E-5 2.925E-5 AX =677.758 9.347E-6 -1.427E-5 8.776E-6 AYDe=553.527 -1.427E- 2.954E-5 -1.853E-5 AZDe=552.978 8.776E-6 -1.853E-5 1.470E-5 AXD=677.756 9.170E-6 -1.415E-5 8.570E-6 AYDC=553.533 -1.415E-5 3.010E-5 -1.862E-5 AZpc=552.975 8.570E-6 -1.862E-5 1.460E-5
Step by Step Solution
There are 3 Steps involved in it

Get step-by-step solutions from verified subject matter experts