

Question: 1. Given the linear correlation coefficient r and the sample size n, determine the critical values of r and use your finding to state whether
1. Given the linear correlation coefficient r and the sample size n, determine the critical values of r and use your finding to state whether or not the given r represents a significant linear correlation. Use a significance level of 0.05.
r = 0.543, n = 25
A) Critical values: r = 0.396, significant linear correlation
B) Critical values: r = 0.487, significant linear correlation
C) Critical values: r = 0.487, no significant linear correlation
D) Critical values: r = 0.396, no significant linear correlation
Flag question: Question 2
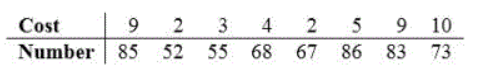
Find the value of the linear correlation coefficient r. The paired data below consist of the temperatures on randomly chosen days and the amount a certain kind of plant grew (in millimeters).
A) -0.210
B) 0.256
C) 0
D) 0.196
Question 3
Suppose you will perform a test to determine whether there is sufficient evidence to support a claim of a linear correlation between two variables. Find the critical values of r given the number of pairs of data n and the significance level ?. n = 12, ?= 0.01
A) r = 0.708
B) r = 0.576
C) r = 0.708
D) r = 0.735
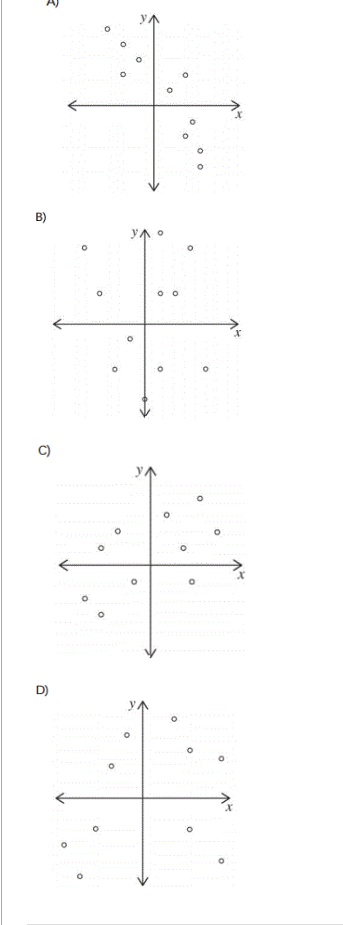
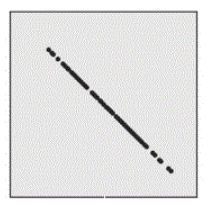
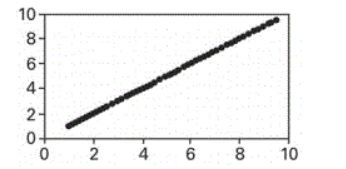
Flag question: Question 4
Determine which plot shows the strongest linear correlation
Step by Step Solution
There are 3 Steps involved in it

Get step-by-step solutions from verified subject matter experts