

Question: 1. Given the table below: Daily Low Frequency(F) Midpoint(xi) f* x (X-u)2 f (x-u)2 Temperature OF 34-39 40 - 45 46-51 5 52-57 7 58
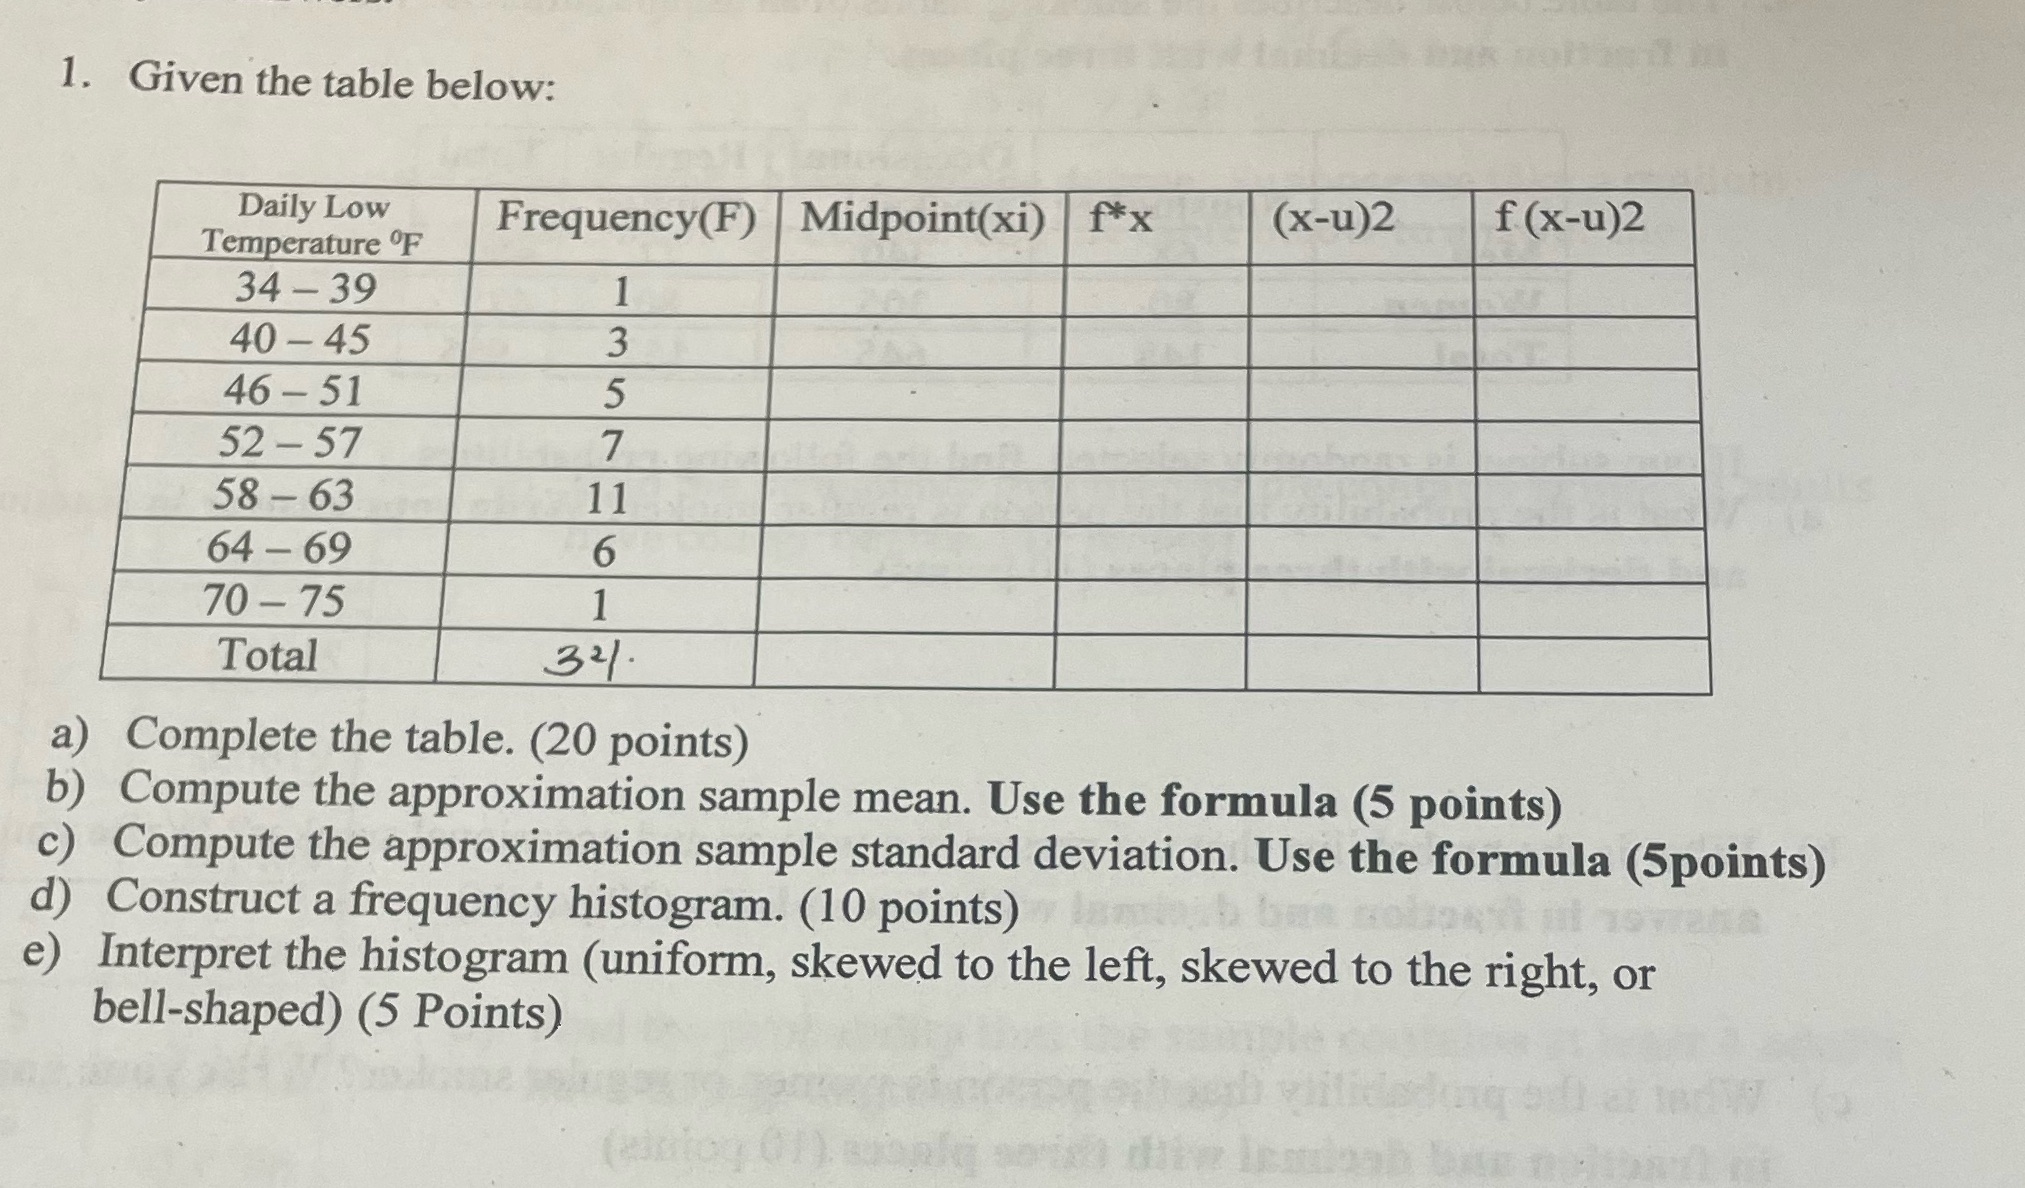
1. Given the table below: Daily Low Frequency(F) Midpoint(xi) f* x (X-u)2 f (x-u)2 Temperature OF 34-39 40 - 45 46-51 5 52-57 7 58 - 63 11 64 - 69 6 70-75 1 Total 321 a) Complete the table. (20 points) b) Compute the approximation sample mean. Use the formula (5 points) c) Compute the approximation sample standard deviation. Use the formula (5points) Construct a frequency histogram. (10 points) e) Interpret the histogram (uniform, skewed to the left, skewed to the right, or bell-shaped) (5 Points)
Step by Step Solution
There are 3 Steps involved in it
1 Expert Approved Answer
Step: 1 Unlock

Question Has Been Solved by an Expert!
Get step-by-step solutions from verified subject matter experts
Step: 2 Unlock
Step: 3 Unlock