

Question: 1) Given the table below, graph the demand and supply curves for ashlights. Make certain to label the equilibrium price and equilibrium quantity. Price lQuantity
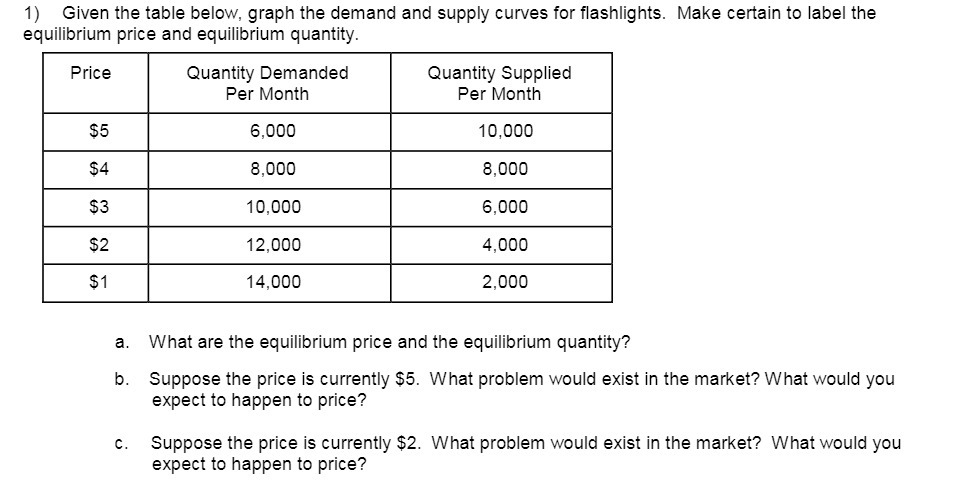
1) Given the table below, graph the demand and supply curves for ashlights. Make certain to label the equilibrium price and equilibrium quantity. Price lQuantity Demanded Quantity Supplied Per Month Per Month 5,000 10.000 10,000 5,000 12,000 4,000 14,000 2,000 a. What are the equilibrium price and the equilibrium quantity? b. Suppose the price is currently $5. What problem would exist in the market? What would you expect to happen to price? c. Suppose the price is currently $2. What problem would exist in the market? What would you expect to happen to price
Step by Step Solution
There are 3 Steps involved in it
1 Expert Approved Answer
Step: 1 Unlock

Question Has Been Solved by an Expert!
Get step-by-step solutions from verified subject matter experts
Step: 2 Unlock
Step: 3 Unlock