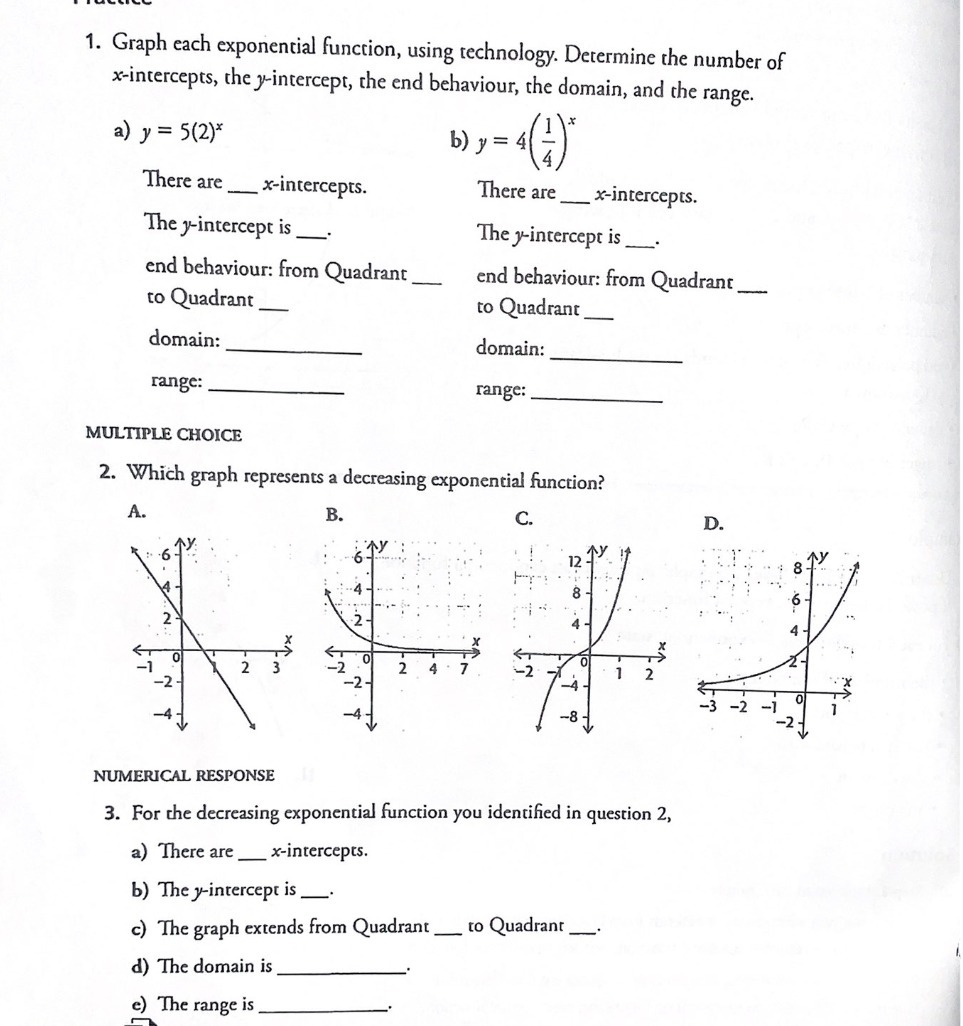
Question: 1. Graph each exponential function, using technology. Determine the number of x-intercepts, the y-intercept, the end behaviour, the domain, and the range. a) y =

1. Graph each exponential function, using
1. Graph each exponential function, using technology. Determine the number of x-intercepts, the y-intercept, the end behaviour, the domain, and the range. a) y = 5(2)* b) y = 4 (2 ) There are _x-intercepts. There are _x-intercepts. The y-intercept is The y-intercept is end behaviour: from Quadrant end behaviour: from Quadrant . to Quadrant to Quadrant domain: domain: range: range: MULTIPLE CHOICE 2. Which graph represents a decreasing exponential function? A. B. C. D. 12 TX NUMERICAL RESPONSE 3. For the decreasing exponential function you identified in question 2, a) There are _x-intercepts. b) The y-intercept is _ c) The graph extends from Quadrant _ to Quadrant d) The domain is e) The range is

Step by Step Solution

There are 3 Steps involved in it

1 Expert Approved Answer
Step: 1 Unlock blur-text-image
Question Has Been Solved by an Expert!

Get step-by-step solutions from verified subject matter experts

Step: 2 Unlock
Step: 3 Unlock

Students Have Also Explored These Related Mathematics Questions!