

Question: 1. Graph the function. Clearly draw the asymptotes on the graph. y 12 g(x) 10 x Step 1: What are the asymptotes of the
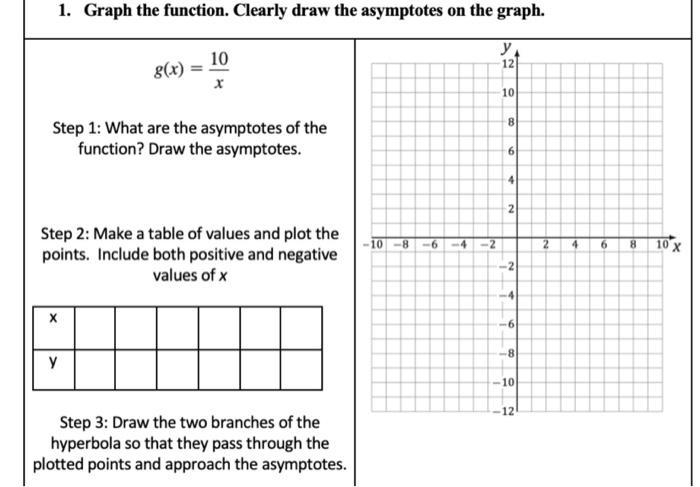
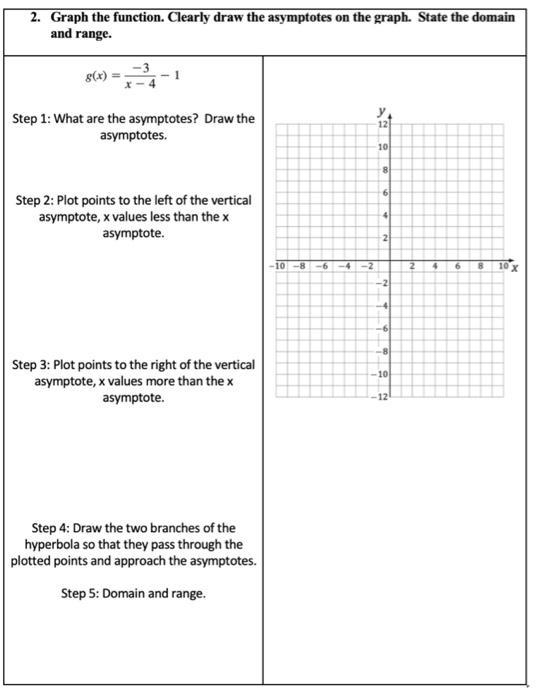
1. Graph the function. Clearly draw the asymptotes on the graph. y 12 g(x) 10 x Step 1: What are the asymptotes of the function? Draw the asymptotes. y Step 2: Make a table of values and plot the points. Include both positive and negative values of x Step 3: Draw the two branches of the hyperbola so that they pass through the plotted points and approach the asymptotes. 10-8 -6 -4 -2 10 8 6 4 2 -2 -4 -6 -8 10 12 2 4 6 8 10 X 2. Graph the function. Clearly draw the asymptotes on the graph. State the domain and range. g(x) Step 1: What are the asymptotes? Draw the asymptotes. Step 2: Plot points to the left of the vertical asymptote, x values less than the x asymptote. Step 3: Plot points to the right of the vertical asymptote, x values more than the x asymptote. Step 4: Draw the two branches of the hyperbola so that they pass through the plotted points and approach the asymptotes. Step 5: Domain and range. 10 -8 -6 -4 -2 12 10 8 6 4 2 -2 -4 -6 -8 -10 12 2 4 6 8 10 X
Step by Step Solution
3.40 Rating (162 Votes )
There are 3 Steps involved in it
1 the function gx 10x has the following asymptotes The above plot sho... View full answer

Get step-by-step solutions from verified subject matter experts