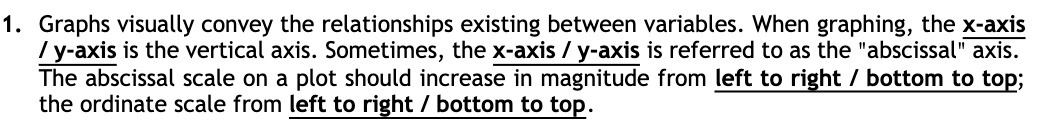
Question: 1. Graphs visually convey the relationships existing between variables. When graphing, the x-axis I y-axis is the vertical axis. Sometimes, the x-axis I y-axis is

1. Graphs visually convey the relationships
1. Graphs visually convey the relationships existing between variables. When graphing, the x-axis I y-axis is the vertical axis. Sometimes, the x-axis I y-axis is referred to as the "abscissal" axis. The abscissal scale on a plot should increase in magnitude from left to right / bottom to top; the ordinate scale from left to right / bottom to top

Step by Step Solution

There are 3 Steps involved in it

1 Expert Approved Answer
Step: 1 Unlock blur-text-image
Question Has Been Solved by an Expert!

Get step-by-step solutions from verified subject matter experts

Step: 2 Unlock
Step: 3 Unlock

Students Have Also Explored These Related Mathematics Questions!