

Question: 1. Guided Problem Solving Use the data at the right to make two line graphs. The first graph should show great change in the winning
1.
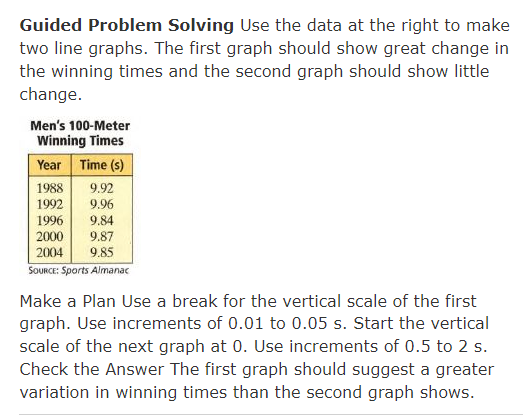
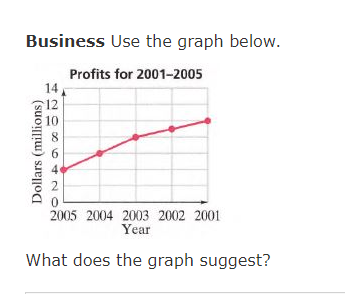
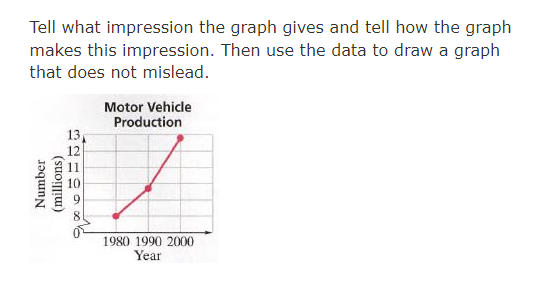
Guided Problem Solving Use the data at the right to make two line graphs. The first graph should show great change in the winning times and the second graph should show little change. Men's 100-Meter Winning Times SOURCE: Sports Almanag Make a Plan Use a break for the vertical scale of the first graph. Use increments of 0.01 to 0.05 s. Start the vertical scale of the next graph at 0. Use increments of 0.5 to 2 s. Check the Answer The first graph should suggest a greater variation in winning times than the second graph shows. Business Use the graph below. Profits for 2001-2005 14 Dollars (millions) ONADOGN 2005 2004 2003 2002 2001 Year What does the graph suggest?Tell what impression the graph gives and tell how the graph makes this impression. Then use the data to draw a graph that does not mislead. Motor Vehicle Production Number ( millions) 1980 1990 2000 Year
Step by Step Solution
There are 3 Steps involved in it

Get step-by-step solutions from verified subject matter experts