

Question: 1. How fast can SNAG grow without violating its debt covenants if it uses 100% debt financing and pays out 40% of its earnings as
1. How fast can SNAG grow without violating its debt covenants if it uses 100% debt financing and pays out 40% of its earnings as dividends? If it uses 80% debt and 20% equity financing and pays out 40% of its net earnings as dividends?
2. What are the answers to the above questions when the tax rate is 40%?
3.What is SNAGs diluted value per share for each of the above four scenarios? 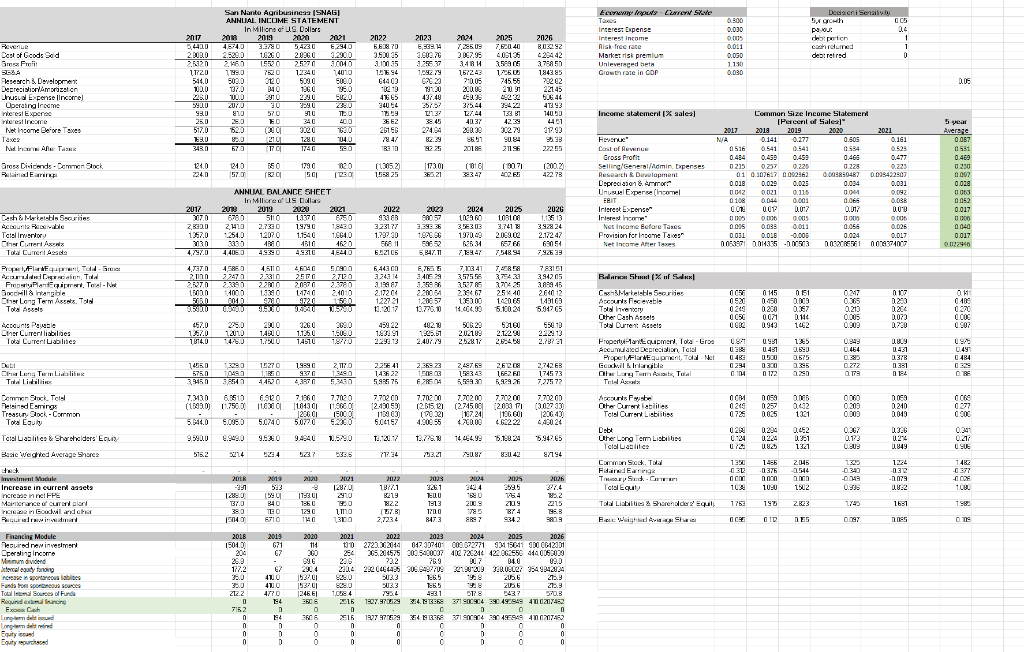
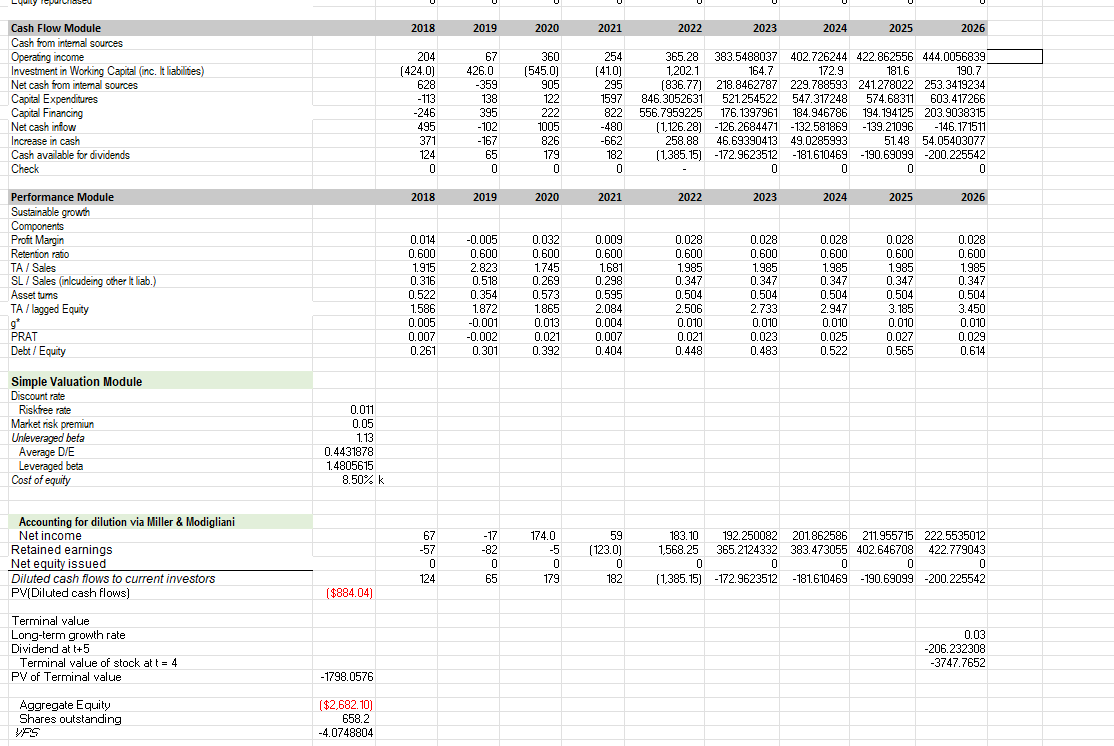
* Felier Dear God: 3.0 banna WEB - - e . amm , Deprecambizalon Ubersino free le carcere Let 15:50w tern: 28 Nu hare e Dres Dividende - Down Sack gg , mmm.5 %E5%, g Y, 2Bayer 925_ "Piccone Statem 1240080178000 13852 [SPM 043018 brary ANNUAL BALANCE SHEE M Cash Mateistis Serije fcial mare erred Iris Place new mease 0.024 TVm tw% s is m Fair. Tocal - Not Ons Le Temeres. Tad - a ge 1 | trin i ==== daru Sul (Xuf Sex [wal-Asselable ans EEB 5. ncuuuuucci * Propel, Flande quanto clas in Tulial like w m Desindamine ArmarkF Teis Cumartesi 888 Total Liable & Shareholders Etui S 0 0 9.990.06.949.0 95% 1984 150 51526284 527 5835 5.1-8.24 1.30 PS4 LES) 4 689 | 18 Other room Liabili 5.9026 18:124 18:14 [url. Suit,Tada Fred Earing Total Equi Toa Lisbilis hackery Equity 8 AC3. 22.06.2 czuki .. CES 0 0 tern 21:12: FINAFTER 2013 Juline * 17 3773 24 THE 7Tg 2018 2019 2020 2021 2022 2023 2024 2025 2026 Cash Flow Module Cash from internal sources Operating income Investment in Working Capital (inc. It liabilites) Net cash from internal sources Capital Expenditures Capital Financing Net cash inflow Increase in cash Cash available for dividends Check 204 (424.0) 628 - 113 -246 495 371 124 0 67 426.0 -359 138 395 -102 -167 65 0 360 (545.0) 905 122 222 1005 826 179 0 254 (410) 295 1597 822 -480 -662 182 0 365.28 383.5488037 402.726244 422.862556 444.0056839 1,202.1 164.7 172.9 181.6 190.7 (836.77) 218.8462787 229.788593 241.278022 253.3419234 ) 846.3052631 521.254522 547.317248 574.68311 603.417266 556.7959225 176.1397961 184.946786 194.194125 203.9038315 (1,126.28) -126.2684471 -132.581869 -139.21096 -146.171511 258.88 46.69390413 49.0285993 51.48 54.05403077 (1,385.15) -172.9623512 -181.610469 -190.69099 -200.225542 0 0 0 0 2018 2019 2020 2021 2022 2023 2024 2025 2026 Performance Module Sustainable growth Components Profit Margin Retention ratio TA/ Sales SL / Sales (inlcudeing other it liab.) Asset tums TA / lagged Equity g' PRAT Debt / Equity 0.014 0.600 1.915 0.316 0.522 1.586 0.005 0.007 0.261 -0.005 0.600 2.823 0.518 0.354 1.872 -0.001 -0.002 0.301 0.032 0.600 1.745 0.269 0.573 1.865 0.013 0.021 0.392 0.009 0.600 1.681 0.298 0.595 2.084 0.004 0.007 0.404 0.028 0.600 1.985 0.347 0.504 2.506 0.010 0.021 0.448 0.028 0.600 1.985 0.347 0.504 2.733 0.010 0.023 0.483 0.028 0.600 1.985 0.347 0.504 2.947 0.010 0.025 0.522 0.028 0.600 1.985 0.347 0.504 3.185 0.010 0.027 0.565 0.028 0.600 1.985 0.347 0.504 3.450 0.010 0.029 0.614 Simple Valuation Module Discount rate Riskfree rate Market risk premiun Unleveraged beta Average D/E Leveraged beta Cost of equity 0.011 0.05 1.13 0.4431878 1.4805615 8.50% k Accounting for dilution via Miller & Modigliani Net income Retained earnings Net equity issued Diluted cash flows to current investors PV(Diluted cash flows) 67 -57 0 124 -17 -82 0 65 174.0 -5 0 179 59 (123.0) 0 182 183.10 192.250082 201.862586 211.955715 222.5535012 1.568.25 365.2124332 383.473055 402.646708 422.779043 0 0 0 0 0 (1,385.15) -172.9623512 -181.610469 -190.69099 -200.225542 ($884.04) Terminal value Long-term growth rate Dividend at 1+5 Terminal value of stock at t = 4 PV of Terminal value 0.03 -206.232308 -3747.7652 -1798.0576 Aggregate Equity Shares outstanding VAS ($2,682. 10) 658.2 -4.0748804 * Felier Dear God: 3.0 banna WEB - - e . amm , Deprecambizalon Ubersino free le carcere Let 15:50w tern: 28 Nu hare e Dres Dividende - Down Sack gg , mmm.5 %E5%, g Y, 2Bayer 925_ "Piccone Statem 1240080178000 13852 [SPM 043018 brary ANNUAL BALANCE SHEE M Cash Mateistis Serije fcial mare erred Iris Place new mease 0.024 TVm tw% s is m Fair. Tocal - Not Ons Le Temeres. Tad - a ge 1 | trin i ==== daru Sul (Xuf Sex [wal-Asselable ans EEB 5. ncuuuuucci * Propel, Flande quanto clas in Tulial like w m Desindamine ArmarkF Teis Cumartesi 888 Total Liable & Shareholders Etui S 0 0 9.990.06.949.0 95% 1984 150 51526284 527 5835 5.1-8.24 1.30 PS4 LES) 4 689 | 18 Other room Liabili 5.9026 18:124 18:14 [url. Suit,Tada Fred Earing Total Equi Toa Lisbilis hackery Equity 8 AC3. 22.06.2 czuki .. CES 0 0 tern 21:12: FINAFTER 2013 Juline * 17 3773 24 THE 7Tg 2018 2019 2020 2021 2022 2023 2024 2025 2026 Cash Flow Module Cash from internal sources Operating income Investment in Working Capital (inc. It liabilites) Net cash from internal sources Capital Expenditures Capital Financing Net cash inflow Increase in cash Cash available for dividends Check 204 (424.0) 628 - 113 -246 495 371 124 0 67 426.0 -359 138 395 -102 -167 65 0 360 (545.0) 905 122 222 1005 826 179 0 254 (410) 295 1597 822 -480 -662 182 0 365.28 383.5488037 402.726244 422.862556 444.0056839 1,202.1 164.7 172.9 181.6 190.7 (836.77) 218.8462787 229.788593 241.278022 253.3419234 ) 846.3052631 521.254522 547.317248 574.68311 603.417266 556.7959225 176.1397961 184.946786 194.194125 203.9038315 (1,126.28) -126.2684471 -132.581869 -139.21096 -146.171511 258.88 46.69390413 49.0285993 51.48 54.05403077 (1,385.15) -172.9623512 -181.610469 -190.69099 -200.225542 0 0 0 0 2018 2019 2020 2021 2022 2023 2024 2025 2026 Performance Module Sustainable growth Components Profit Margin Retention ratio TA/ Sales SL / Sales (inlcudeing other it liab.) Asset tums TA / lagged Equity g' PRAT Debt / Equity 0.014 0.600 1.915 0.316 0.522 1.586 0.005 0.007 0.261 -0.005 0.600 2.823 0.518 0.354 1.872 -0.001 -0.002 0.301 0.032 0.600 1.745 0.269 0.573 1.865 0.013 0.021 0.392 0.009 0.600 1.681 0.298 0.595 2.084 0.004 0.007 0.404 0.028 0.600 1.985 0.347 0.504 2.506 0.010 0.021 0.448 0.028 0.600 1.985 0.347 0.504 2.733 0.010 0.023 0.483 0.028 0.600 1.985 0.347 0.504 2.947 0.010 0.025 0.522 0.028 0.600 1.985 0.347 0.504 3.185 0.010 0.027 0.565 0.028 0.600 1.985 0.347 0.504 3.450 0.010 0.029 0.614 Simple Valuation Module Discount rate Riskfree rate Market risk premiun Unleveraged beta Average D/E Leveraged beta Cost of equity 0.011 0.05 1.13 0.4431878 1.4805615 8.50% k Accounting for dilution via Miller & Modigliani Net income Retained earnings Net equity issued Diluted cash flows to current investors PV(Diluted cash flows) 67 -57 0 124 -17 -82 0 65 174.0 -5 0 179 59 (123.0) 0 182 183.10 192.250082 201.862586 211.955715 222.5535012 1.568.25 365.2124332 383.473055 402.646708 422.779043 0 0 0 0 0 (1,385.15) -172.9623512 -181.610469 -190.69099 -200.225542 ($884.04) Terminal value Long-term growth rate Dividend at 1+5 Terminal value of stock at t = 4 PV of Terminal value 0.03 -206.232308 -3747.7652 -1798.0576 Aggregate Equity Shares outstanding VAS ($2,682. 10) 658.2 -4.0748804
Step by Step Solution
There are 3 Steps involved in it

Get step-by-step solutions from verified subject matter experts