

Question: 1) How long on average a customer waits in security line 1? Provide your answer in minutes and round the answer to two decimal points.
1) How long on average a customer waits in security line 1? Provide your answer in minutes and round the answer to two decimal points.
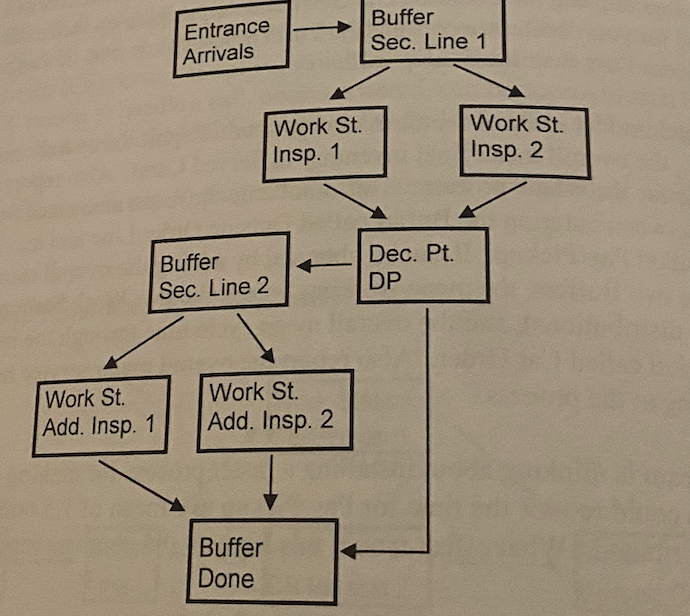
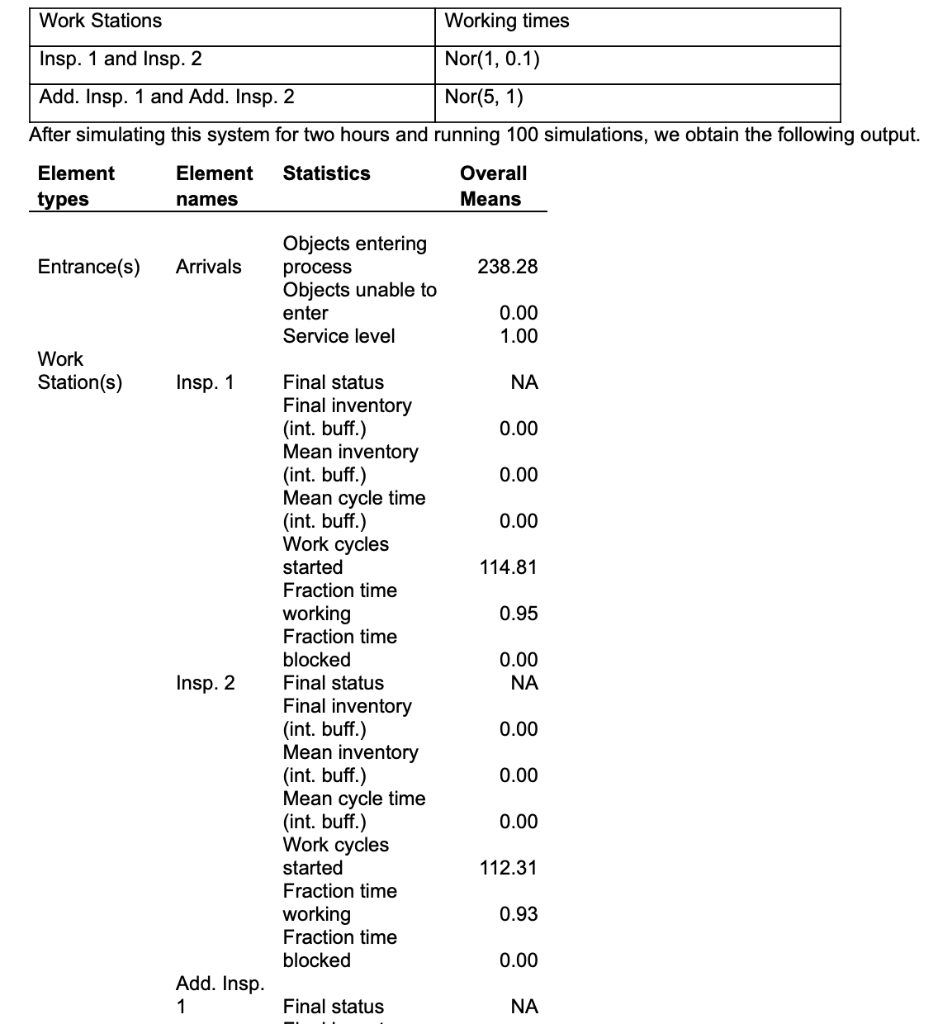
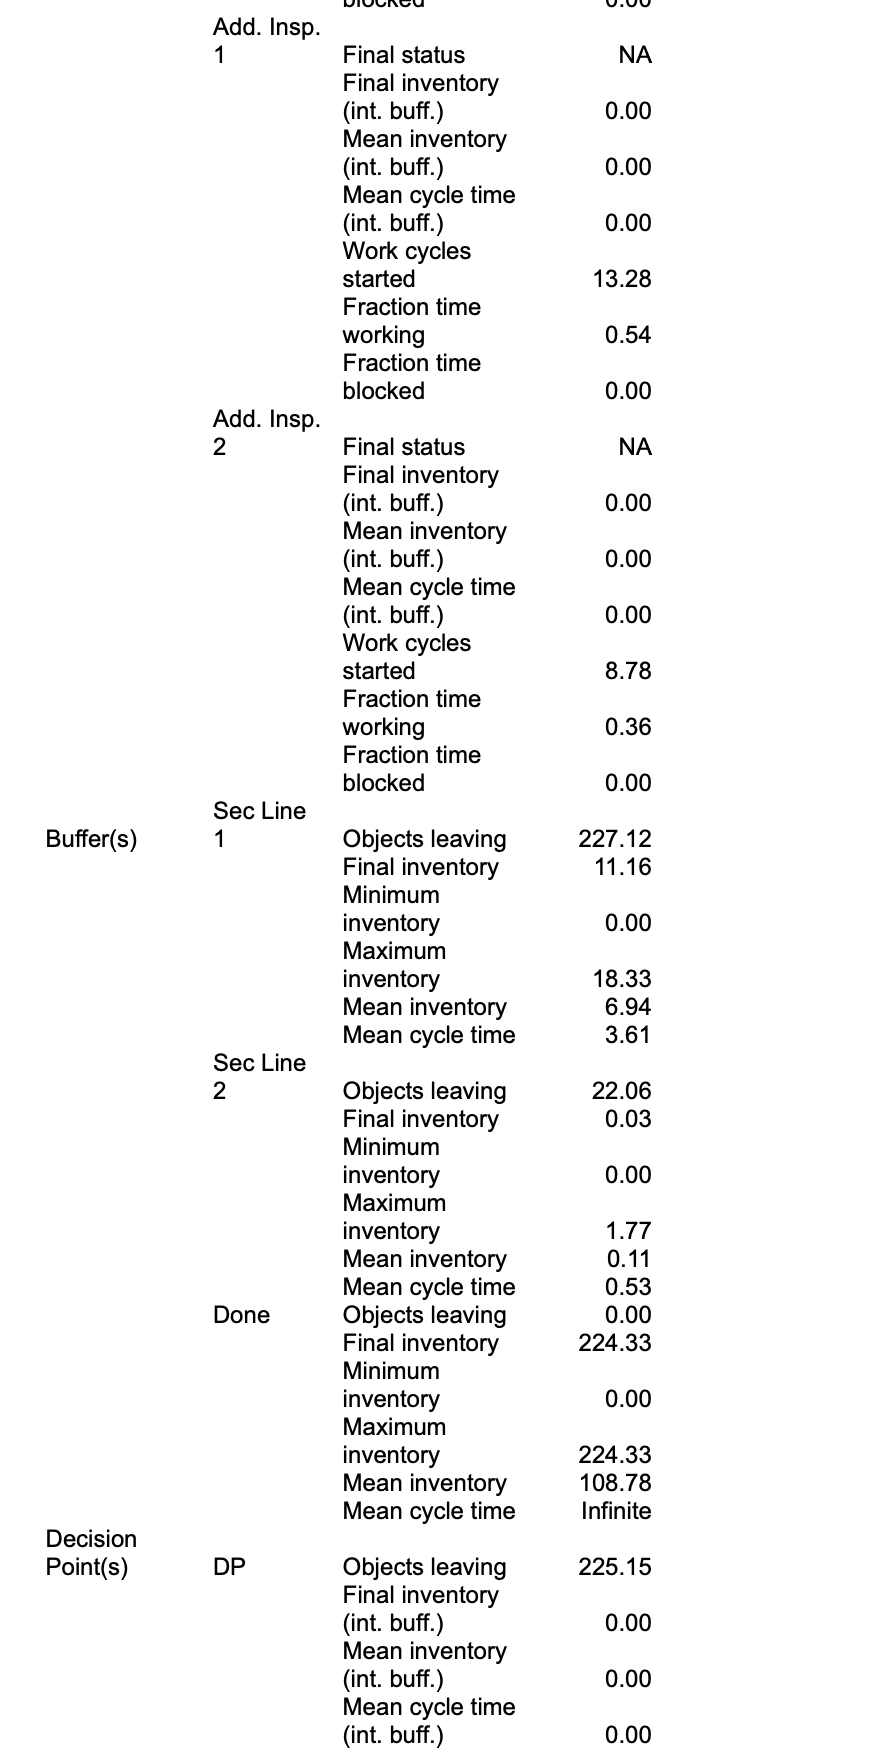
Entrance Arrivals Buffer Sec. Line 1 Work St. Insp. 1 Work St. Insp. 2 Buffer Sec. Line 2 Dec. Pt. DP Work St. Add. Insp. 1 Work St. Add. Insp. 2 Buffer Done Work Stations Working times Insp. 1 and Insp. 2 Nor(1, 0.1) Add. Insp. 1 and Add. Insp. 2 Nor(5, 1) After simulating this system for two hours and running 100 simulations, we obtain the following output. Element Element Statistics Overall types names Means Entrance(s) Arrivals 238.28 Objects entering process Objects unable to enter Service level 0.00 1.00 Work Station(s) Insp. 1 NA 0.00 0.00 0.00 114.81 0.95 Final status Final inventory (int. buff.) Mean inventory (int. buff.) Mean cycle time (int. buff.) Work cycles started Fraction time working Fraction time blocked Final status Final inventory (int. buff.) Mean inventory (int. buff.) Mean cycle time (int. buff.) Work cycles started Fraction time working Fraction time blocked 0.00 NA Insp. 2 0.00 0.00 0.00 112.31 0.93 0.00 Add. Insp. 1 Final status NA 3 Add. Insp. 1 NA 0.00 0.00 Final status Final inventory (int. buff.) Mean inventory (int. buff.) Mean cycle time (int. buff.) Work cycles started Fraction time working Fraction time blocked 0.00 13.28 0.54 0.00 Add. Insp. 2 NA 0.00 0.00 Final status Final inventory (int. buff.) Mean inventory (int. buff.) Mean cycle time (int. buff.) Work cycles started Fraction time working Fraction time blocked 0.00 8.78 0.36 0.00 Sec Line 1 Buffer(s) 227.12 11.16 0.00 Objects leaving Final inventory Minimum inventory Maximum inventory Mean inventory Mean cycle time 18.33 6.94 3.61 Sec Line 2 22.06 0.03 0.00 Objects leaving Final inventory Minimum inventory Maximum inventory Mean inventory Mean cycle time Objects leaving Final inventory Minimum inventory Maximum inventory Mean inventory Mean cycle time 1.77 0.11 0.53 0.00 224.33 Done 0.00 224.33 108.78 Infinite Decision Point(s) DP 225.15 0.00 Objects leaving Final inventory (int. buff.) Mean inventory (int. buff.) Mean cycle time (int. buff.) 0.00 0.00 Entrance Arrivals Buffer Sec. Line 1 Work St. Insp. 1 Work St. Insp. 2 Buffer Sec. Line 2 Dec. Pt. DP Work St. Add. Insp. 1 Work St. Add. Insp. 2 Buffer Done Work Stations Working times Insp. 1 and Insp. 2 Nor(1, 0.1) Add. Insp. 1 and Add. Insp. 2 Nor(5, 1) After simulating this system for two hours and running 100 simulations, we obtain the following output. Element Element Statistics Overall types names Means Entrance(s) Arrivals 238.28 Objects entering process Objects unable to enter Service level 0.00 1.00 Work Station(s) Insp. 1 NA 0.00 0.00 0.00 114.81 0.95 Final status Final inventory (int. buff.) Mean inventory (int. buff.) Mean cycle time (int. buff.) Work cycles started Fraction time working Fraction time blocked Final status Final inventory (int. buff.) Mean inventory (int. buff.) Mean cycle time (int. buff.) Work cycles started Fraction time working Fraction time blocked 0.00 NA Insp. 2 0.00 0.00 0.00 112.31 0.93 0.00 Add. Insp. 1 Final status NA 3 Add. Insp. 1 NA 0.00 0.00 Final status Final inventory (int. buff.) Mean inventory (int. buff.) Mean cycle time (int. buff.) Work cycles started Fraction time working Fraction time blocked 0.00 13.28 0.54 0.00 Add. Insp. 2 NA 0.00 0.00 Final status Final inventory (int. buff.) Mean inventory (int. buff.) Mean cycle time (int. buff.) Work cycles started Fraction time working Fraction time blocked 0.00 8.78 0.36 0.00 Sec Line 1 Buffer(s) 227.12 11.16 0.00 Objects leaving Final inventory Minimum inventory Maximum inventory Mean inventory Mean cycle time 18.33 6.94 3.61 Sec Line 2 22.06 0.03 0.00 Objects leaving Final inventory Minimum inventory Maximum inventory Mean inventory Mean cycle time Objects leaving Final inventory Minimum inventory Maximum inventory Mean inventory Mean cycle time 1.77 0.11 0.53 0.00 224.33 Done 0.00 224.33 108.78 Infinite Decision Point(s) DP 225.15 0.00 Objects leaving Final inventory (int. buff.) Mean inventory (int. buff.) Mean cycle time (int. buff.) 0.00 0.00Step by Step Solution
There are 3 Steps involved in it
1 Expert Approved Answer
Step: 1 Unlock

Question Has Been Solved by an Expert!
Get step-by-step solutions from verified subject matter experts
Step: 2 Unlock
Step: 3 Unlock