

Question: 1. HPR and corresponding probability for each scenario are given in the table. The information in last column is probability weighted deviation of HPR from
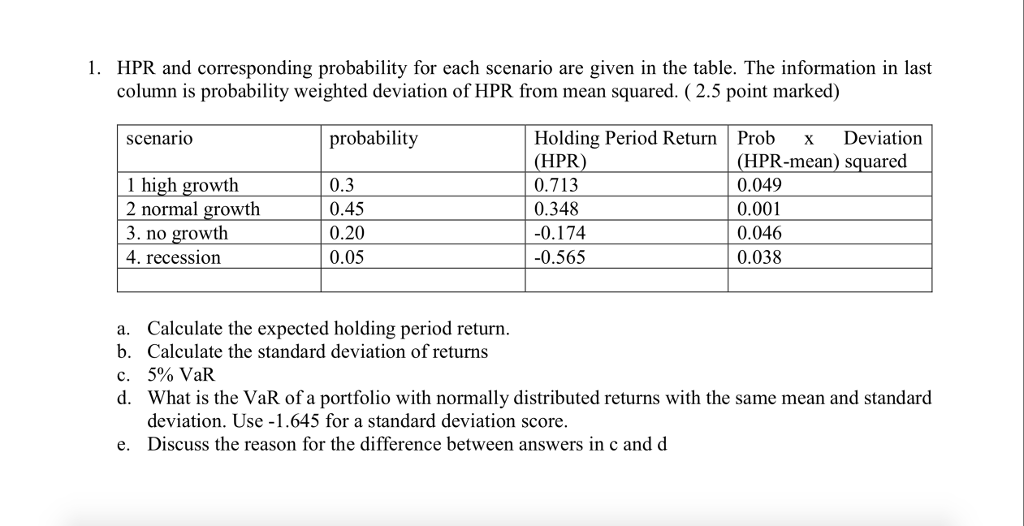
1. HPR and corresponding probability for each scenario are given in the table. The information in last column is probability weighted deviation of HPR from mean squared. (2.5 point marked) Holding Period Return Prob x Deviation HPR 0.713 0.348 0.174 -0.565 scenario probability 1 high growth 2 normal growth 3. no growth 4. recession 0.3 0.45 0.20 0.05 (HPR-mean) squared 0.049 0.001 0.046 0.038 a. b. C. d. Calculate the expected holding period return Calculate the standard deviation of returns 5% VaR What is the VaR of a portfolio with normally distributed returns with the same mean and standard deviation. Use -1.645 for a standard deviation score Discuss the reason for the difference between answers in c and d e. 1. HPR and corresponding probability for each scenario are given in the table. The information in last column is probability weighted deviation of HPR from mean squared. (2.5 point marked) Holding Period Return Prob x Deviation HPR 0.713 0.348 0.174 -0.565 scenario probability 1 high growth 2 normal growth 3. no growth 4. recession 0.3 0.45 0.20 0.05 (HPR-mean) squared 0.049 0.001 0.046 0.038 a. b. C. d. Calculate the expected holding period return Calculate the standard deviation of returns 5% VaR What is the VaR of a portfolio with normally distributed returns with the same mean and standard deviation. Use -1.645 for a standard deviation score Discuss the reason for the difference between answers in c and d e
Step by Step Solution
There are 3 Steps involved in it

Get step-by-step solutions from verified subject matter experts