

Question: 1) If the data come from a sample: Define the desired target population and describe how the sample was collected.If you were not able to
1) If the data come from a sample:Define the desired target population and describe how the sample was collected.If you were not able to sample from the desired population, state what differences you might expect between the population that was actually sampled from and the desired target population.If you were not able to take a simple random sample from the population, discuss how the sampling could be improved if you were allowed more money and time.
If the data come from an experiment:Describe how the experiment was carried out, describe any sources of extra variation (e.g. changing temperature, different people making the measurements, etc...).Did you try to control these?Discuss how the experiment could be improved if you were allowed (more) money and time.
2)Statistics:The report of the test you performed should includeat leastthe following statistics:a confidence interval, the p-value for testing, and descriptive statistics & graphs.Make sure and tell the reader why these statistics should be useful to them,and interpret them in the context of your data set.
Assumptions:Check the assumptions needed. Give relevant plots that you use to check the model assumptions (see above).
3) Finally, don't forget to include a short summary at the end of your paper to tie everything together!
You can build a regression model, test a hypothesis for mean(s), proportion(s), standard deviation(s)/variance(s). You can use data from another class/lab/project, just be sure to cite your source.
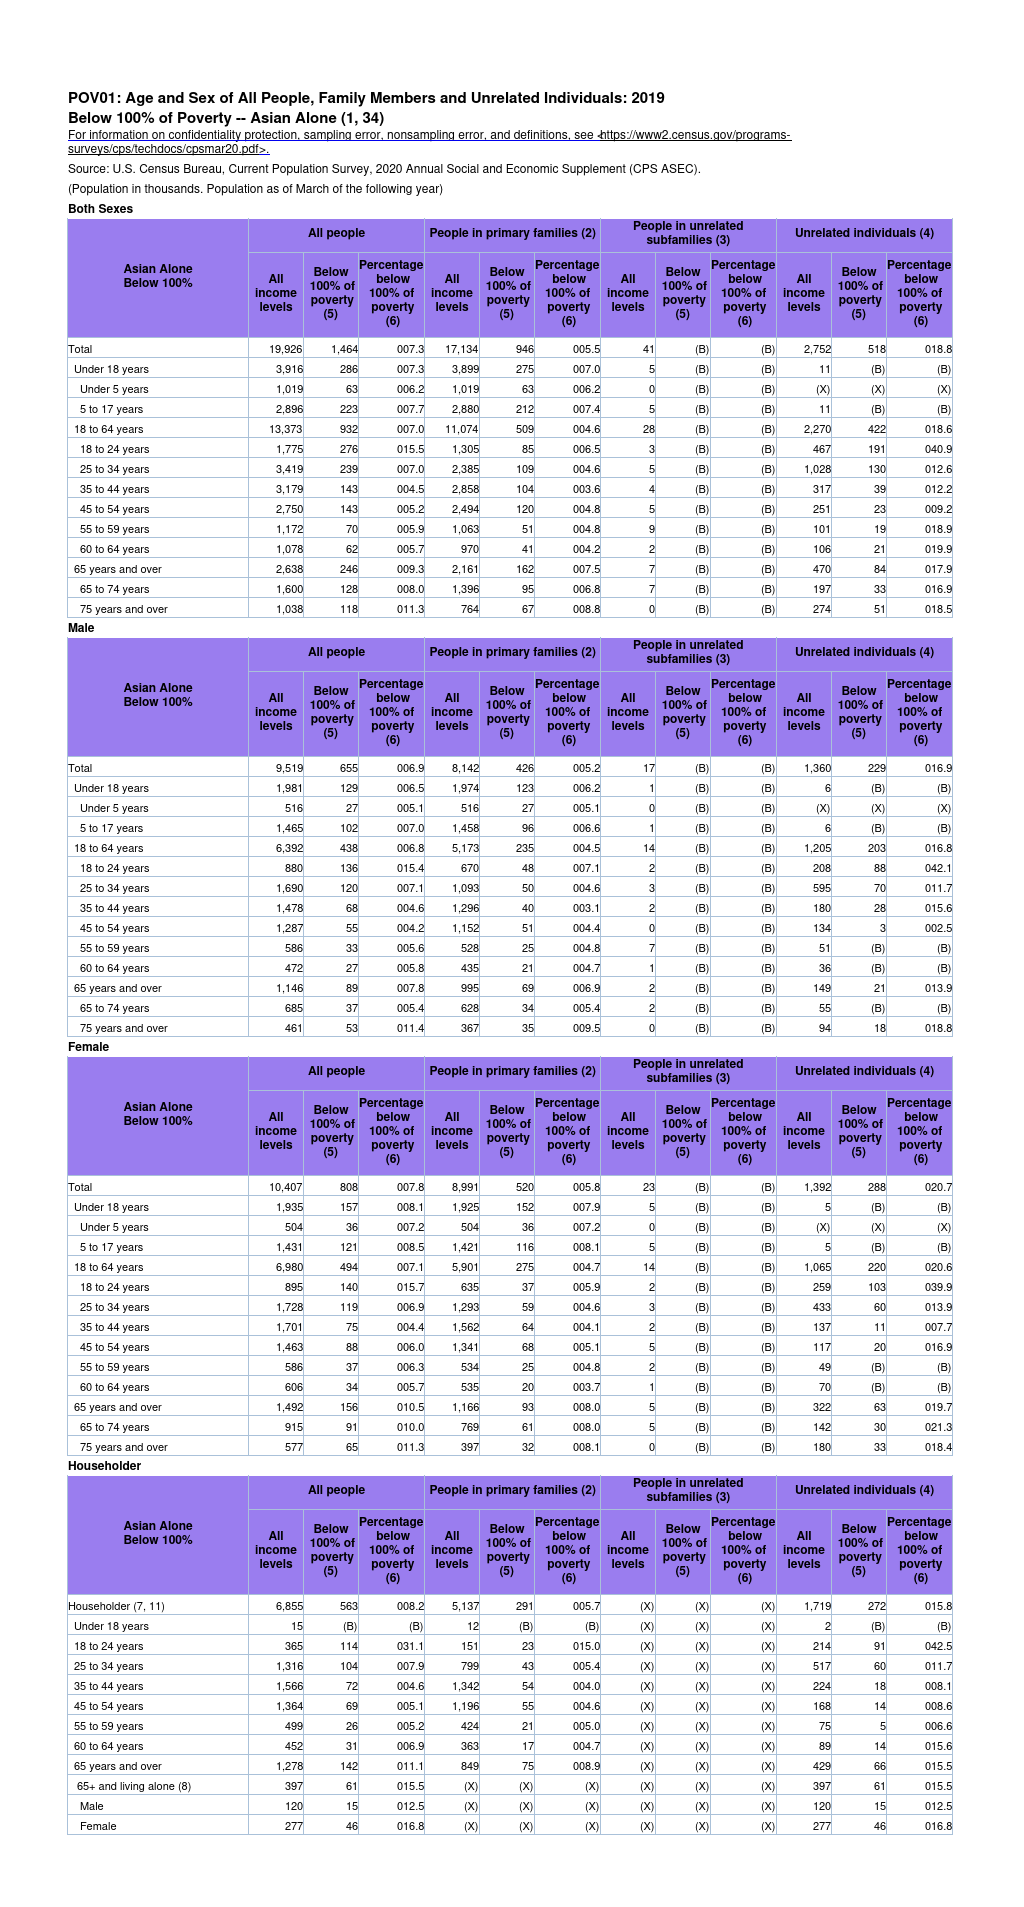
POV01: Age and Sex of All People, Family Members and Unrelated Individuals: 2019 Below 100% of Poverty -- Asian Alone (1, 34) For information on confidentiality protection. sampling error, nonsampling error, and definitions, see https//www2.census.gov/programs- surveys/cps/techdocs/cpsmar20.pdf>. Source: U.S. Census Bureau, Current Population Survey, 2020 Annual Social and Economic Supplement (CPS ASEC). (Population in thousands. Population as of March of the following year) Both Sexes People in unrelated All people People in primary families (2) Unrelated individuals (4) subfamilies (3) Percentage Asian Alone Below Percentage Percentage Below Percentage Below Below below All below All below 100% of below Below 100% All 100% of 100% of 100% of 100% of income 100% of income 100% of ncome 100% of income poverty poverty poverty poverty poverty poverty levels levels poverty levels (5) (5) (5) poverty levels (5) (6) (6) (6) (6) 2,752 518 018. Total 19,926 1,464 007.3 17,13 946 005.5 41 (B (B) (B 11 (B) (B) Under 18 years 3,916 286 007.3 3.899 275 007.0 (X) Under 5 years 1,019 63 006.2 1.019 63 006.2 (B) (B (X (X) 11 (B) (B) 5 to 17 years 2,896 23 007.7 2,880 212 007.4 (B) (B) 18 to 64 years 13,37 32 007.0 11,074 509 004.6 (B) ( B ) 2,27 422 018.6 18 to 24 years 1,775 276 015.5 1,305 85 006.5 (B) (B) 467 191 040.9 ,419 239 007.0 2.385 09 004.6 (B) (B 1.028 130 012.6 25 to 34 years 2.858 104 003.6 (B) ( B) 317 39 012.2 35 to 44 years 3,179 143 004.5 009.2 45 to 54 years 2,750 143 105.2 2.494 120 04.8 (B) ( B ) 251 23 1,172 70 005.9 1.063 51 004.8 (B) (B) 101 19 018.9 55 to 59 years 019.9 005.7 41 (B) 21 62 004.2 (B) 106 60 to 64 years 1,078 970 2.638 246 009.3 2,161 162 007.5 (B) (B) 470 84 017.9 65 years and over 1,600 128 008.0 1.396 95 006.8 (B) (B) 197 33 016.9 65 to 74 years 018.5 75 years and over 1,038 118 011.3 764 67 008.8 B) 274 Male People in unrelated All people People in primary families (2) Unrelated individuals (4) subfamilies (3) Percentage Percentage Below Percentage Asian Alone Below Percentage Below Below below All below All below All below 100% of income 100% of 100% of Below 100% 100% of 100% of income 100% of 100% of income 100% of income poverty poverty poverty levels poverty levels poverty levels poverty levels poverty poverty (5) (5) (5) (5) (6) (6) (6) (6) 7 B B 1,360 229 016.9 Total 9,519 655 006.9 8,142 426 05.2 Under 18 years 1,981 129 006.5 1,974 123 006.2 1 (B) (B 6 (B) (B) 27 005.1 516 27 005.1 o (B) (B) (X) (X ) (X) Under 5 years 516 96 006.6 1 (B) (B) B) (B) 5 to 17 years 1.465 102 007. 1,458 5,392 138 006.8 5,173 235 004.5 14 (B) ( B ) 1,205 203 016.8 18 to 64 years 88 042.1 18 to 24 years 880 136 015.4 670 48 007.1 (B) ( B ) 208 70 25 to 34 years 1,690 120 007.1 1.093 D04.6 (B) ( B ) 595 11.7 ONON 003.1 (B) ( B ) 180 28 015.6 35 to 44 years 1,478 68 004.6 1,296 55 004.2 1,152 51 004.4 (B) ( B) 134 3 002.5 45 to 54 years 1,287 (B) 55 to 59 years 586 33 005.6 528 25 004.8 7 (B) (B) 51 B) (B) (B) 36 (B) (B IN 60 to 64 years 472 27 005.8 435 004.7 89 007.8 995 69 006.9 (B) (B ) 149 21 013.9 ON N - 65 years and over 1.146 (B ) 55 (B) 65 to 74 years 685 37 005. 628 34 005.4 (B) 35 18 367 009.5 ( B) 018. 75 years and over 461 53 011. Femal People in unrelated People in primary families (2) Unrelated individuals (4) All people subfamilies (3) Percentage Asian Alone Below Percentage Below Below Percentage Below Percentage All below All 100% of below All All below Below 100% 100% of 100% of income 100% of below 100% of income poverty 100% of 100% of income ncome poverty poverty poverty 100% of levels poverty levels (5) poverty levels poverty levels (5) poverty (5) (5) (6) (6) (6) (6) 020.7 Total 10,407 808 007.8 8,991 520 005.8 23 (B) (B) 1,392 288 1,935 157 008.1 1.925 152 007.9 (B) (B 5 (B (B) Under 18 years 504 36 007.2 (B) (B X) (X) Under 5 years 504 36 007.2 1,431 21 008.5 1.421 16 008.1 (B) (B en (B) (B 5 to 17 years 5.901 275 004.7 (B) (B) 1,065 220 020. 18 to 64 years 6,980 494 007.1 18 to 24 years 895 140 015.7 635 37 05.9 (B) ( B ) 259 103 039.9 25 to 34 years 1,728 119 006.9 1,293 59 004.6 (B) ( B ) 433 60 013.9 35 to 44 years 1,701 75 004.4 1,562 004.1 (B) (B) 137 11 007.7 005.1 (B) (B) 117 20 016.9 45 to 54 years 1,463 88 006.0 1,341 534 004.8 (B) (B ) 49 (B) (B) 55 to 59 years 586 37 006.3 34 005.7 535 003.7 (B) (B ) 70 (B) (B 60 to 64 years 606 156 010.5 1,166 93 008.0 (B) (B) 322 63 019.7 65 years and over 1,492 61 008.0 (B) (B) 142 30 021.3 65 to 74 years 915 91 010. 769 011.3 32 008.1 (B) 180 33 018.4 75 years and over 577 65 397 B) Householde People in unrelated All people People in primary families (2) Unrelated individuals (4) subfamilies (3) Percentage Percentage Below Percentage Asian Alone Below Percentage Below All Below All below Below 100% All below All 100% of 100% of below 100% of income 100% of below 100% of 100% of ncome 100% of income 100% of income poverty levels poverty poverty levels poverty poverty levels poverty poverty levels (5) poverty (5) (5) (5) (6 (6) (6) (6) 6,855 563 008.2 5,137 291 005.7 (X) (X) X ,719 272 015. Householder (7, 11) 12 (B ) (B (x) (X) (X 2 (B) (B Under 18 years 15 (B) (B 365 114 031. 151 015. "X) (X) ( X ) 214 91 042.5 18 to 24 years 25 to 34 years 1,316 104 007.9 799 005. "x) (x ) (x ) 517 60 011. 1,566 72 104.6 1,342 004.0 "X) (X) (X ) 224 18 008. 35 to 44 years 45 to 54 years 1,364 69 005.1 1,196 004.6 X) (x) (x) 168 08.6 55 to 59 years 499 26 005.2 424 005.0 "x) (X) (X ) 75 006.6 60 to 64 years 452 31 006.9 363 004.7 (x) 89 14 015.6 66 015.5 65 years and over 1,278 142 011.1 849 008.9 (x) (xX ) (Xx ) 429 397 61 015.5 65+ and living alone (8) 397 61 015.5 (X ) (X) (xx ) ( X ) 120 15 012.5 (x) (XX ) (X (X ) ( X) 120 15 012.5 Male 46 016.8 (x) (x) (X) (X) (X) (X) 46 016. 277 277 Female
Step by Step Solution
There are 3 Steps involved in it

Get step-by-step solutions from verified subject matter experts