

Question: 1. In each of the following settings, explain which variable should be the explanatory and which should be the response Favorite Favorite variable. Then, classify
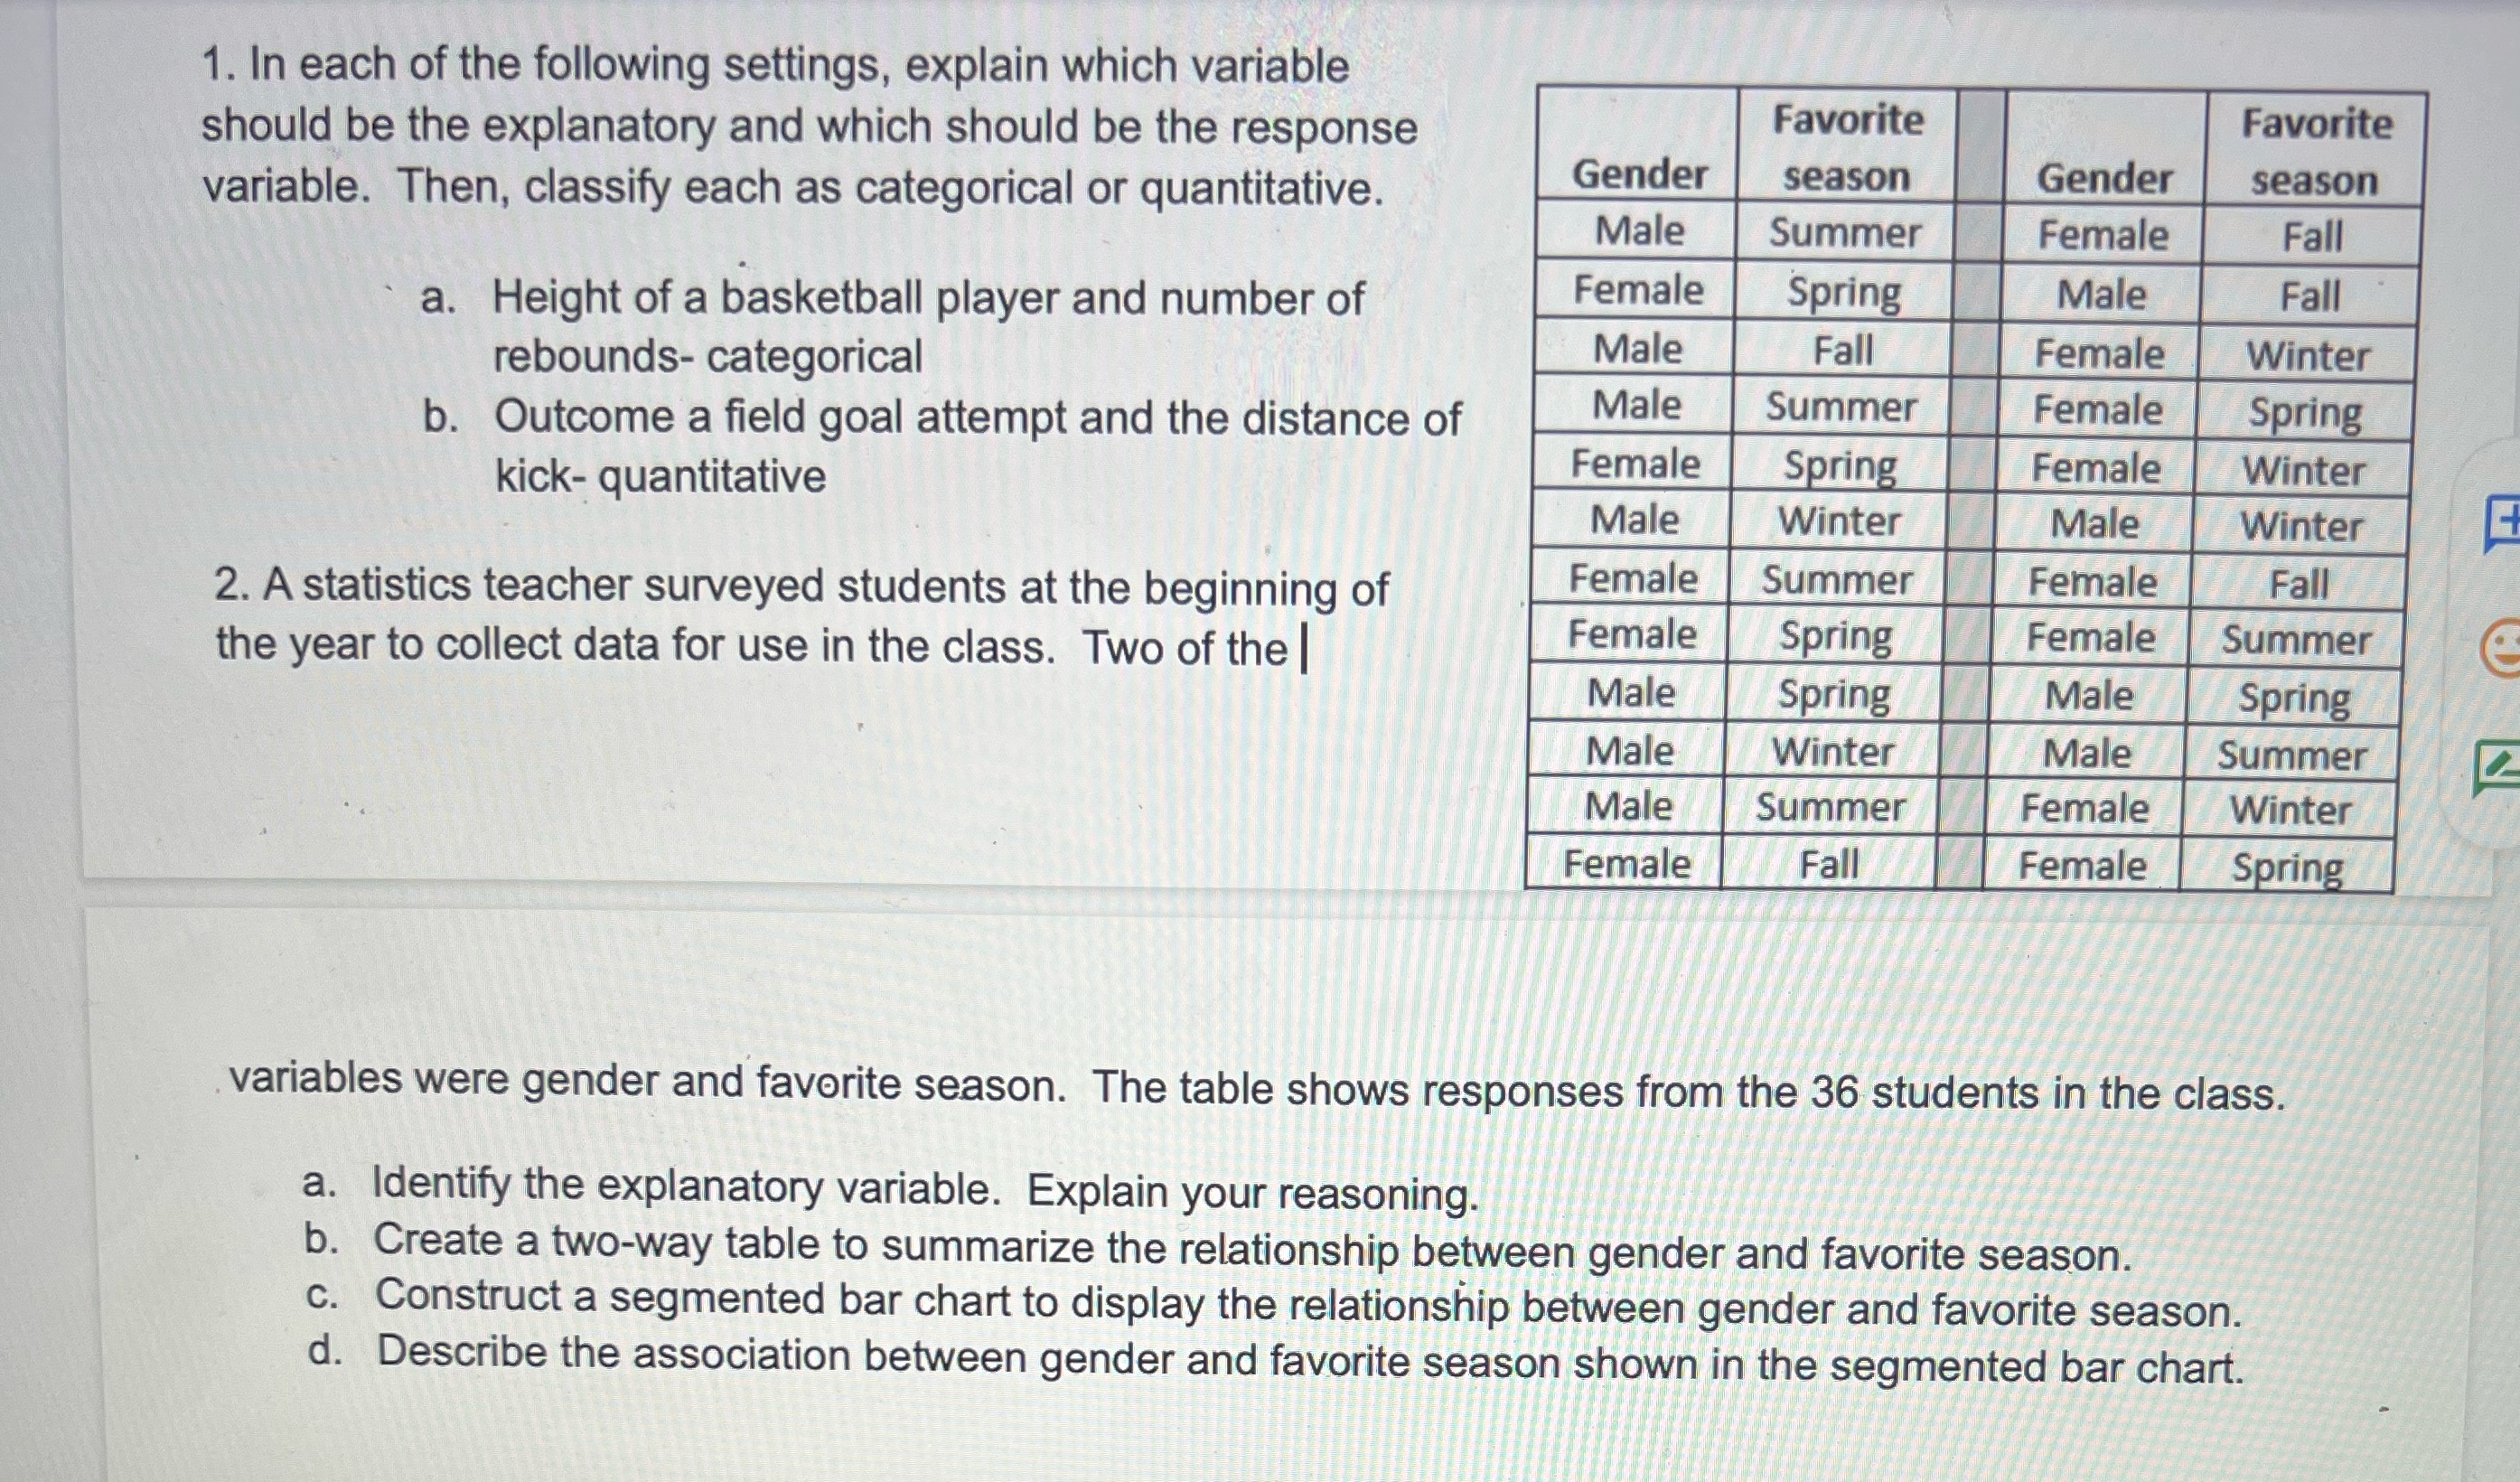
1. In each of the following settings, explain which variable should be the explanatory and which should be the response Favorite Favorite variable. Then, classify each as categorical or quantitative. Gender season Gender season Male Summer Female Fall a. Height of a basketball player and number of Female Spring Male Fall rebounds- categorical Male Fall Female Winter b. Outcome a field goal attempt and the distance of Male Summer Female Spring Spring Female kick- quantitative Female Winter Male Winter Male Winter 2. A statistics teacher surveyed students at the beginning of Female Summer Female Fall the year to collect data for use in the class. Two of the | Female Spring Female Summer Male Spring Male Spring Male Winter Male Summer Male Summer Female Winter Female Fall Female Spring variables were gender and favorite season. The table shows responses from the 36 students in the class. a. Identify the explanatory variable. Explain your reasoning. b. Create a two-way table to summarize the relationship between gender and favorite season. c. Construct a segmented bar chart to display the relationship between gender and favorite season. d. Describe the association between gender and favorite season shown in the segmented bar chart
Step by Step Solution
There are 3 Steps involved in it

Get step-by-step solutions from verified subject matter experts