

Question: 1) In the Income Statement, evaluate each item and write down your interpretation of the progression of the 2008 numbers relative to 2007.` 2) By
 1) In the Income Statement, evaluate each item and write down your interpretation of the progression of the 2008 numbers relative to 2007.`
2) By planning a list of the significant adjustments (with $ values) that you expect to take place with the Company's Income Statement in 2009, plan an EPS forecast for 2009.
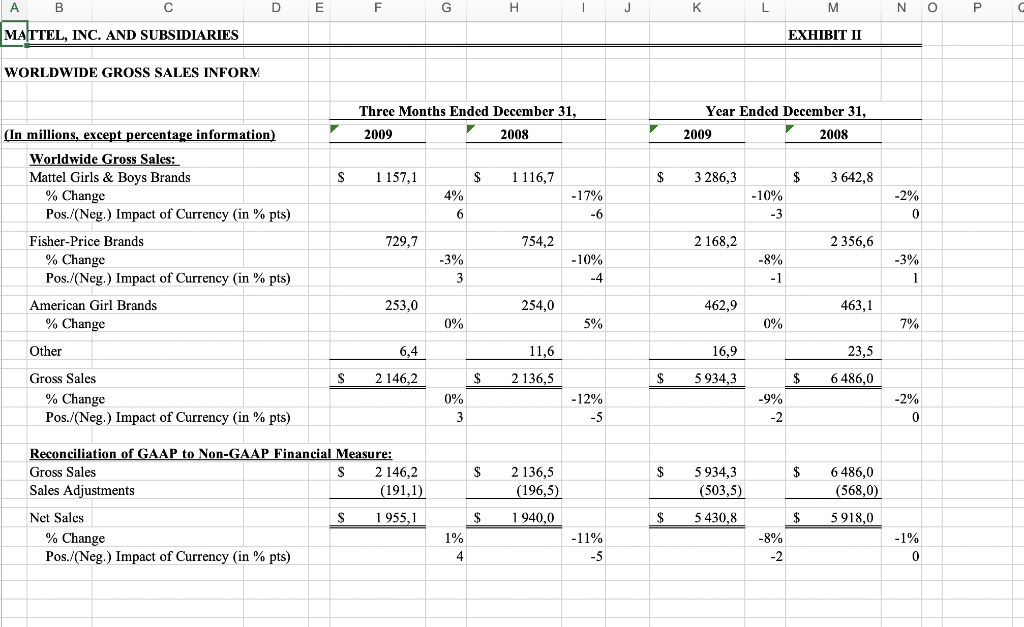
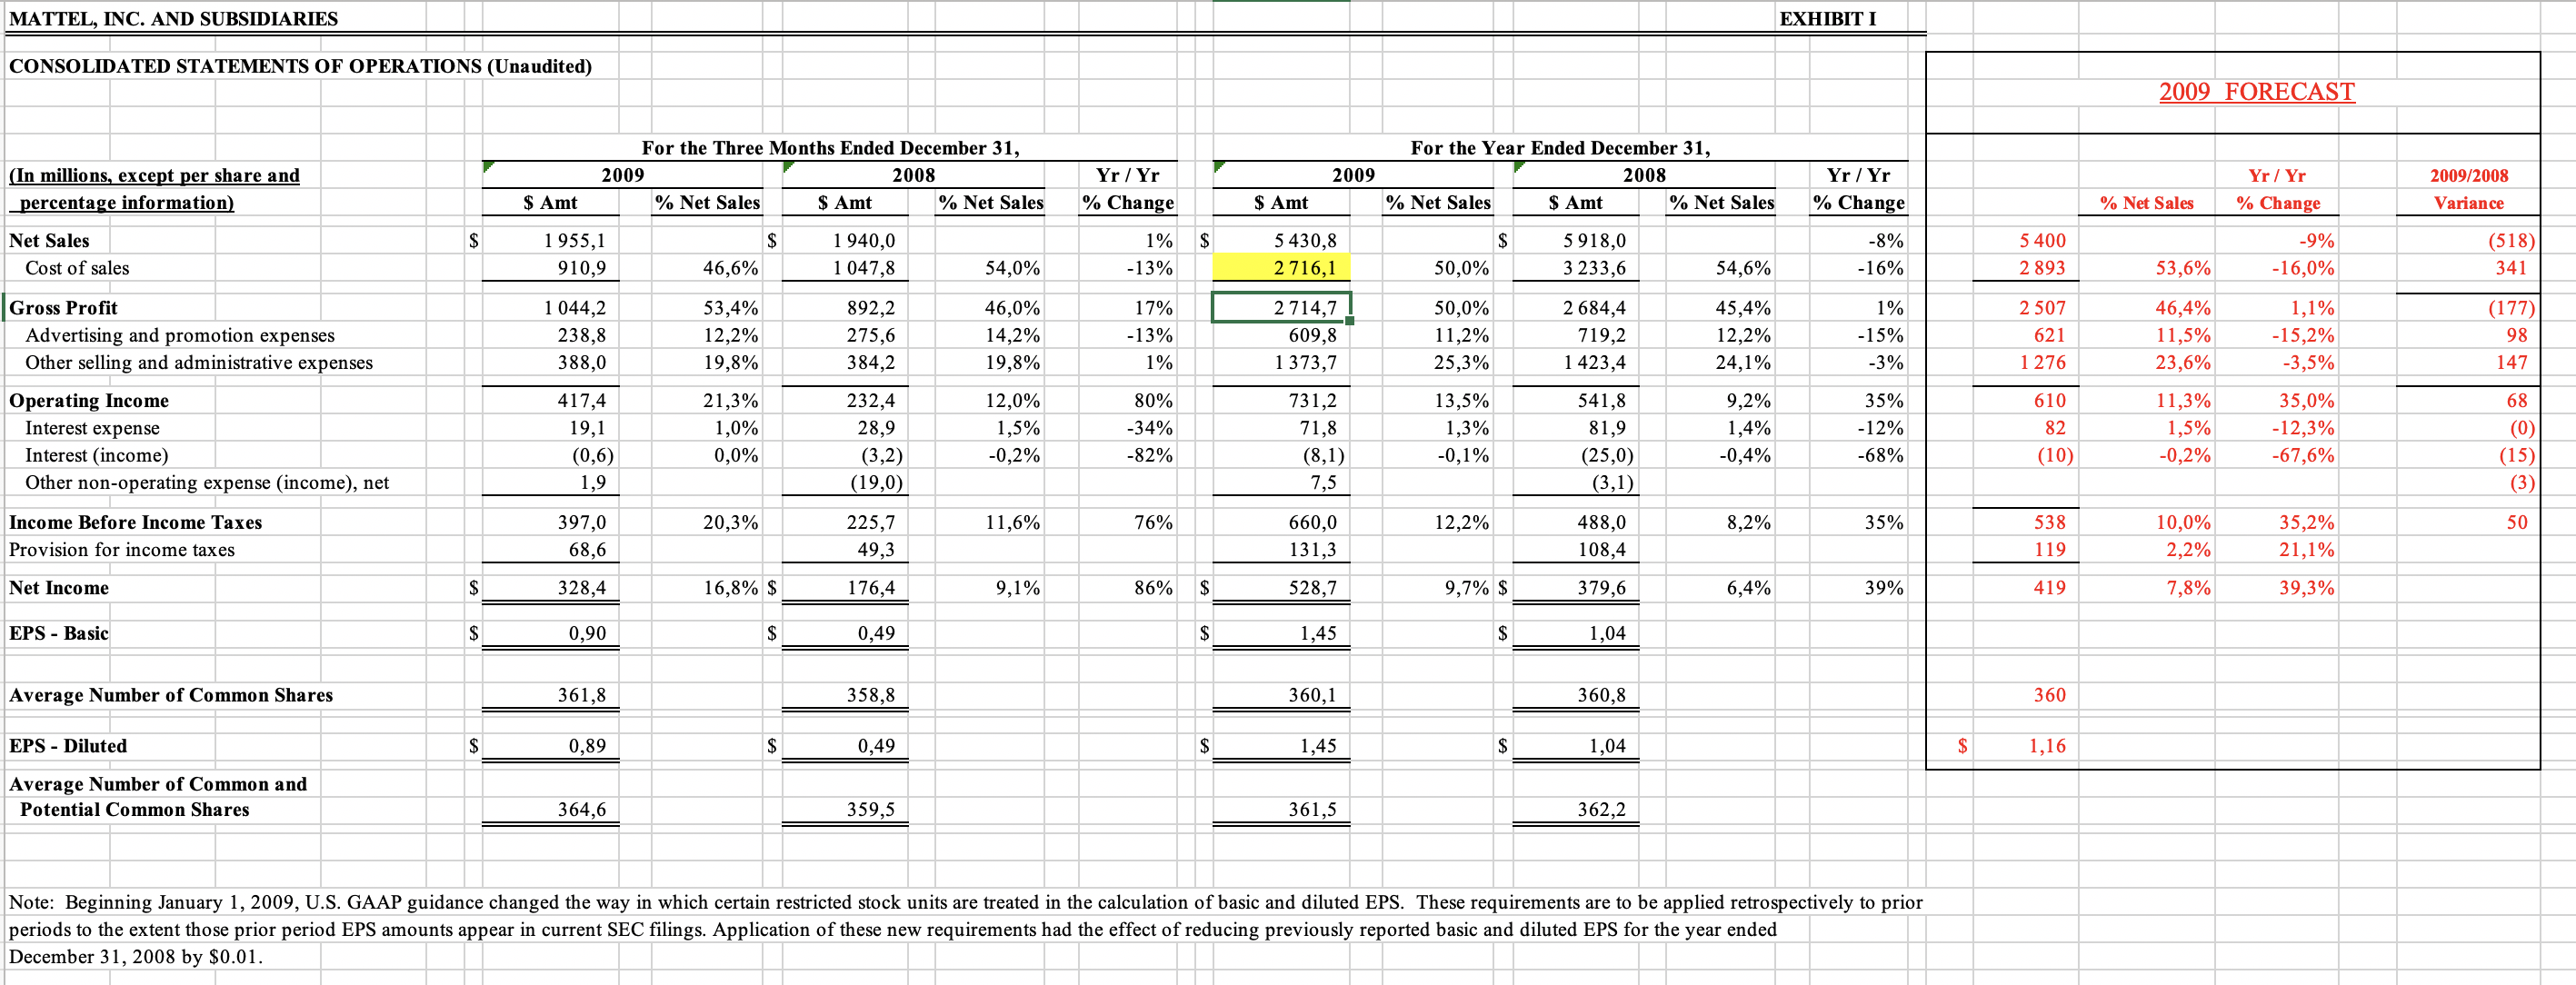
MATTEL, INC. AND SUBSIDIARIES EXHIBIT I CONSOLIDATED STATEMENTS OF OPERATIONS (Unaudited) 2009 FORECAST (In millions, except per share and percentage information) For the Three Months Ended December 31, 2009 2008 % Net Sales $ Amt % Net Sales Yr / Yr % Change For the Year Ended December 31, 2009 2008 % Net Sales $ Amt % Net Sales Yr / Yr % Change Yr / Yr % Change 2009/2008 Variance $ Amt $ Amt % Net Sales $ $ -9% Net Sales Cost of sales 1955,1 910,9 $ 46,6% 1 940,0 1 047,8 1% -13% 5 430,8 2 716,1 $ 50,0% 5918,0 3 233,6 -8% -16% 5400 2 893 (518) 341 54,0% 54,6% 53,6% -16,0% 1 044,2 238,8 388,0 53,4% 12,2% 19,8% 892,2 275,6 384,2 46,0% 14,2% 19,8% 17% -13% 1% 2 714,7 609,8 1 373,7 50,0% 11,2% 25,3% 2 684,4 719,2 1423,4 45,4% 12,2% 24,1% 1% -15% -3% 2 507 621 1276 1,1% -15,2% -3,5% (177) 98 147 Gross Profit Advertising and promotion expenses Other selling and administrative expenses Operating Income Interest expense Interest (income) Other non-operating expense (income), net 46,4% 11,5% 23,6% 11,3% 1,5% -0,2% 68 417,4 19,1 (0,6) 1,9 21,3% 1,0% 0,0% 232,4 28,9 (3,2) (19,0) 12,0% 1,5% -0,2% 80% -34% -82% 731,2 71,8 (8,1) 13,5% 1,3% -0,1% 541,8 81,9 (25,0) (3,1) 9,2% 1,4% -0,4% 35% -12% -68% 610 82 (10) 35,0% -12,3% -67,6% (0) (15) (3) 7,5 20,3% 11,6% 76% 12,2% 8,2% 35% 538 50 Income Before Income Taxes Provision for income taxes 397,0 68,6 225,7 49,3 660,0 131,3 488,0 108,4 10,0% 2,2% 35,2% 21,1% 119 Net Income $ 328,4 16,8% $ 176,4 9,1% 86% $ 528,7 9,7% $ 379,6 6,4% 39% 419 7,8% 39,3% EPS - Basic $ 0,90 $ 0,49 $ 1,45 $ 1,04 Average Number of Common Shares 361,8 358,8 360,1 360,8 360 EPS - Diluted $ 0,89 $ 0,49 $ 1,45 $ 1,04 $ 1,16 Average Number of Common and Potential Common Shares 364,6 359,5 361,5 362,2 Note: Beginning January 1, 2009, U.S. GAAP guidance changed the way in which certain restricted stock units are treated in the calculation of basic and diluted EPS. These requirements are to be applied retrospectively to prior periods to the extent those prior period EPS amounts appear in current SEC filings. Application of these new requirements had the effect of reducing previously reported basic and diluted EPS for the year ended December 31, 2008 by $0.01. A B D E F G H 1 J K L M N 0 P MATTEL, INC. AND SUBSIDIARIES EXHIBIT II WORLDWIDE GROSS SALES INFORM Three Months Ended December 31, 2009 2008 Year Ended December 31, 2009 2008 (In millions, except percentage information) Worldwide Gross Sales: Mattel Girls & Boys Brands % Change Pos./(Neg.) Impact of Currency (in % pts) S 1 157,1 $ 1 116,7 $ 3 286,3 $ 3 642,8 4% 6 -17% -6 -10% -3 -2% 0 729,7 754,2 2 168,2 2 356,6 -3% 3 -10% -4 10% -8% - 1 -3% 1 1 Fisher-Price Brands % Change Pos./(Neg.) Impact of Currency (in % pts) American Girl Brands % Change Other 253,0 254,0 462,9 463,1 0% 5% 0% 7% 6,4 11,6 16,9 23,5 S 2 146,2 $ 2 136,5 $ 5934.3 $ 6 486,0 Gross Sales % Change Pos./(Neg.) Impact of Currency (in % pts) 0% 3 -12% -5 -9% -2 -2% 0 $ $ 2 136,5 (196,5) 5934,3 (503,5) 6 486,0 (568,0) Reconciliation of GAAP to Non-GAAP Financial Measure: Gross Sales S 2 146,2 Sales Adjustments (191,1) Net Sales S 1955,1 % Change Pos./(Neg.) Impact of Currency (in % pts) $ 1 940,0 $ 5430,8 $ 5918,0 1% 4 -11% -5 -8% -2 - 1% 0 MATTEL, INC. AND SUBSIDIARIES EXHIBIT I CONSOLIDATED STATEMENTS OF OPERATIONS (Unaudited) 2009 FORECAST (In millions, except per share and percentage information) For the Three Months Ended December 31, 2009 2008 % Net Sales $ Amt % Net Sales Yr / Yr % Change For the Year Ended December 31, 2009 2008 % Net Sales $ Amt % Net Sales Yr / Yr % Change Yr / Yr % Change 2009/2008 Variance $ Amt $ Amt % Net Sales $ $ -9% Net Sales Cost of sales 1955,1 910,9 $ 46,6% 1 940,0 1 047,8 1% -13% 5 430,8 2 716,1 $ 50,0% 5918,0 3 233,6 -8% -16% 5400 2 893 (518) 341 54,0% 54,6% 53,6% -16,0% 1 044,2 238,8 388,0 53,4% 12,2% 19,8% 892,2 275,6 384,2 46,0% 14,2% 19,8% 17% -13% 1% 2 714,7 609,8 1 373,7 50,0% 11,2% 25,3% 2 684,4 719,2 1423,4 45,4% 12,2% 24,1% 1% -15% -3% 2 507 621 1276 1,1% -15,2% -3,5% (177) 98 147 Gross Profit Advertising and promotion expenses Other selling and administrative expenses Operating Income Interest expense Interest (income) Other non-operating expense (income), net 46,4% 11,5% 23,6% 11,3% 1,5% -0,2% 68 417,4 19,1 (0,6) 1,9 21,3% 1,0% 0,0% 232,4 28,9 (3,2) (19,0) 12,0% 1,5% -0,2% 80% -34% -82% 731,2 71,8 (8,1) 13,5% 1,3% -0,1% 541,8 81,9 (25,0) (3,1) 9,2% 1,4% -0,4% 35% -12% -68% 610 82 (10) 35,0% -12,3% -67,6% (0) (15) (3) 7,5 20,3% 11,6% 76% 12,2% 8,2% 35% 538 50 Income Before Income Taxes Provision for income taxes 397,0 68,6 225,7 49,3 660,0 131,3 488,0 108,4 10,0% 2,2% 35,2% 21,1% 119 Net Income $ 328,4 16,8% $ 176,4 9,1% 86% $ 528,7 9,7% $ 379,6 6,4% 39% 419 7,8% 39,3% EPS - Basic $ 0,90 $ 0,49 $ 1,45 $ 1,04 Average Number of Common Shares 361,8 358,8 360,1 360,8 360 EPS - Diluted $ 0,89 $ 0,49 $ 1,45 $ 1,04 $ 1,16 Average Number of Common and Potential Common Shares 364,6 359,5 361,5 362,2 Note: Beginning January 1, 2009, U.S. GAAP guidance changed the way in which certain restricted stock units are treated in the calculation of basic and diluted EPS. These requirements are to be applied retrospectively to prior periods to the extent those prior period EPS amounts appear in current SEC filings. Application of these new requirements had the effect of reducing previously reported basic and diluted EPS for the year ended December 31, 2008 by $0.01. A B D E F G H 1 J K L M N 0 P MATTEL, INC. AND SUBSIDIARIES EXHIBIT II WORLDWIDE GROSS SALES INFORM Three Months Ended December 31, 2009 2008 Year Ended December 31, 2009 2008 (In millions, except percentage information) Worldwide Gross Sales: Mattel Girls & Boys Brands % Change Pos./(Neg.) Impact of Currency (in % pts) S 1 157,1 $ 1 116,7 $ 3 286,3 $ 3 642,8 4% 6 -17% -6 -10% -3 -2% 0 729,7 754,2 2 168,2 2 356,6 -3% 3 -10% -4 10% -8% - 1 -3% 1 1 Fisher-Price Brands % Change Pos./(Neg.) Impact of Currency (in % pts) American Girl Brands % Change Other 253,0 254,0 462,9 463,1 0% 5% 0% 7% 6,4 11,6 16,9 23,5 S 2 146,2 $ 2 136,5 $ 5934.3 $ 6 486,0 Gross Sales % Change Pos./(Neg.) Impact of Currency (in % pts) 0% 3 -12% -5 -9% -2 -2% 0 $ $ 2 136,5 (196,5) 5934,3 (503,5) 6 486,0 (568,0) Reconciliation of GAAP to Non-GAAP Financial Measure: Gross Sales S 2 146,2 Sales Adjustments (191,1) Net Sales S 1955,1 % Change Pos./(Neg.) Impact of Currency (in % pts) $ 1 940,0 $ 5430,8 $ 5918,0 1% 4 -11% -5 -8% -2 - 1% 0
Step by Step Solution
There are 3 Steps involved in it

Get step-by-step solutions from verified subject matter experts