

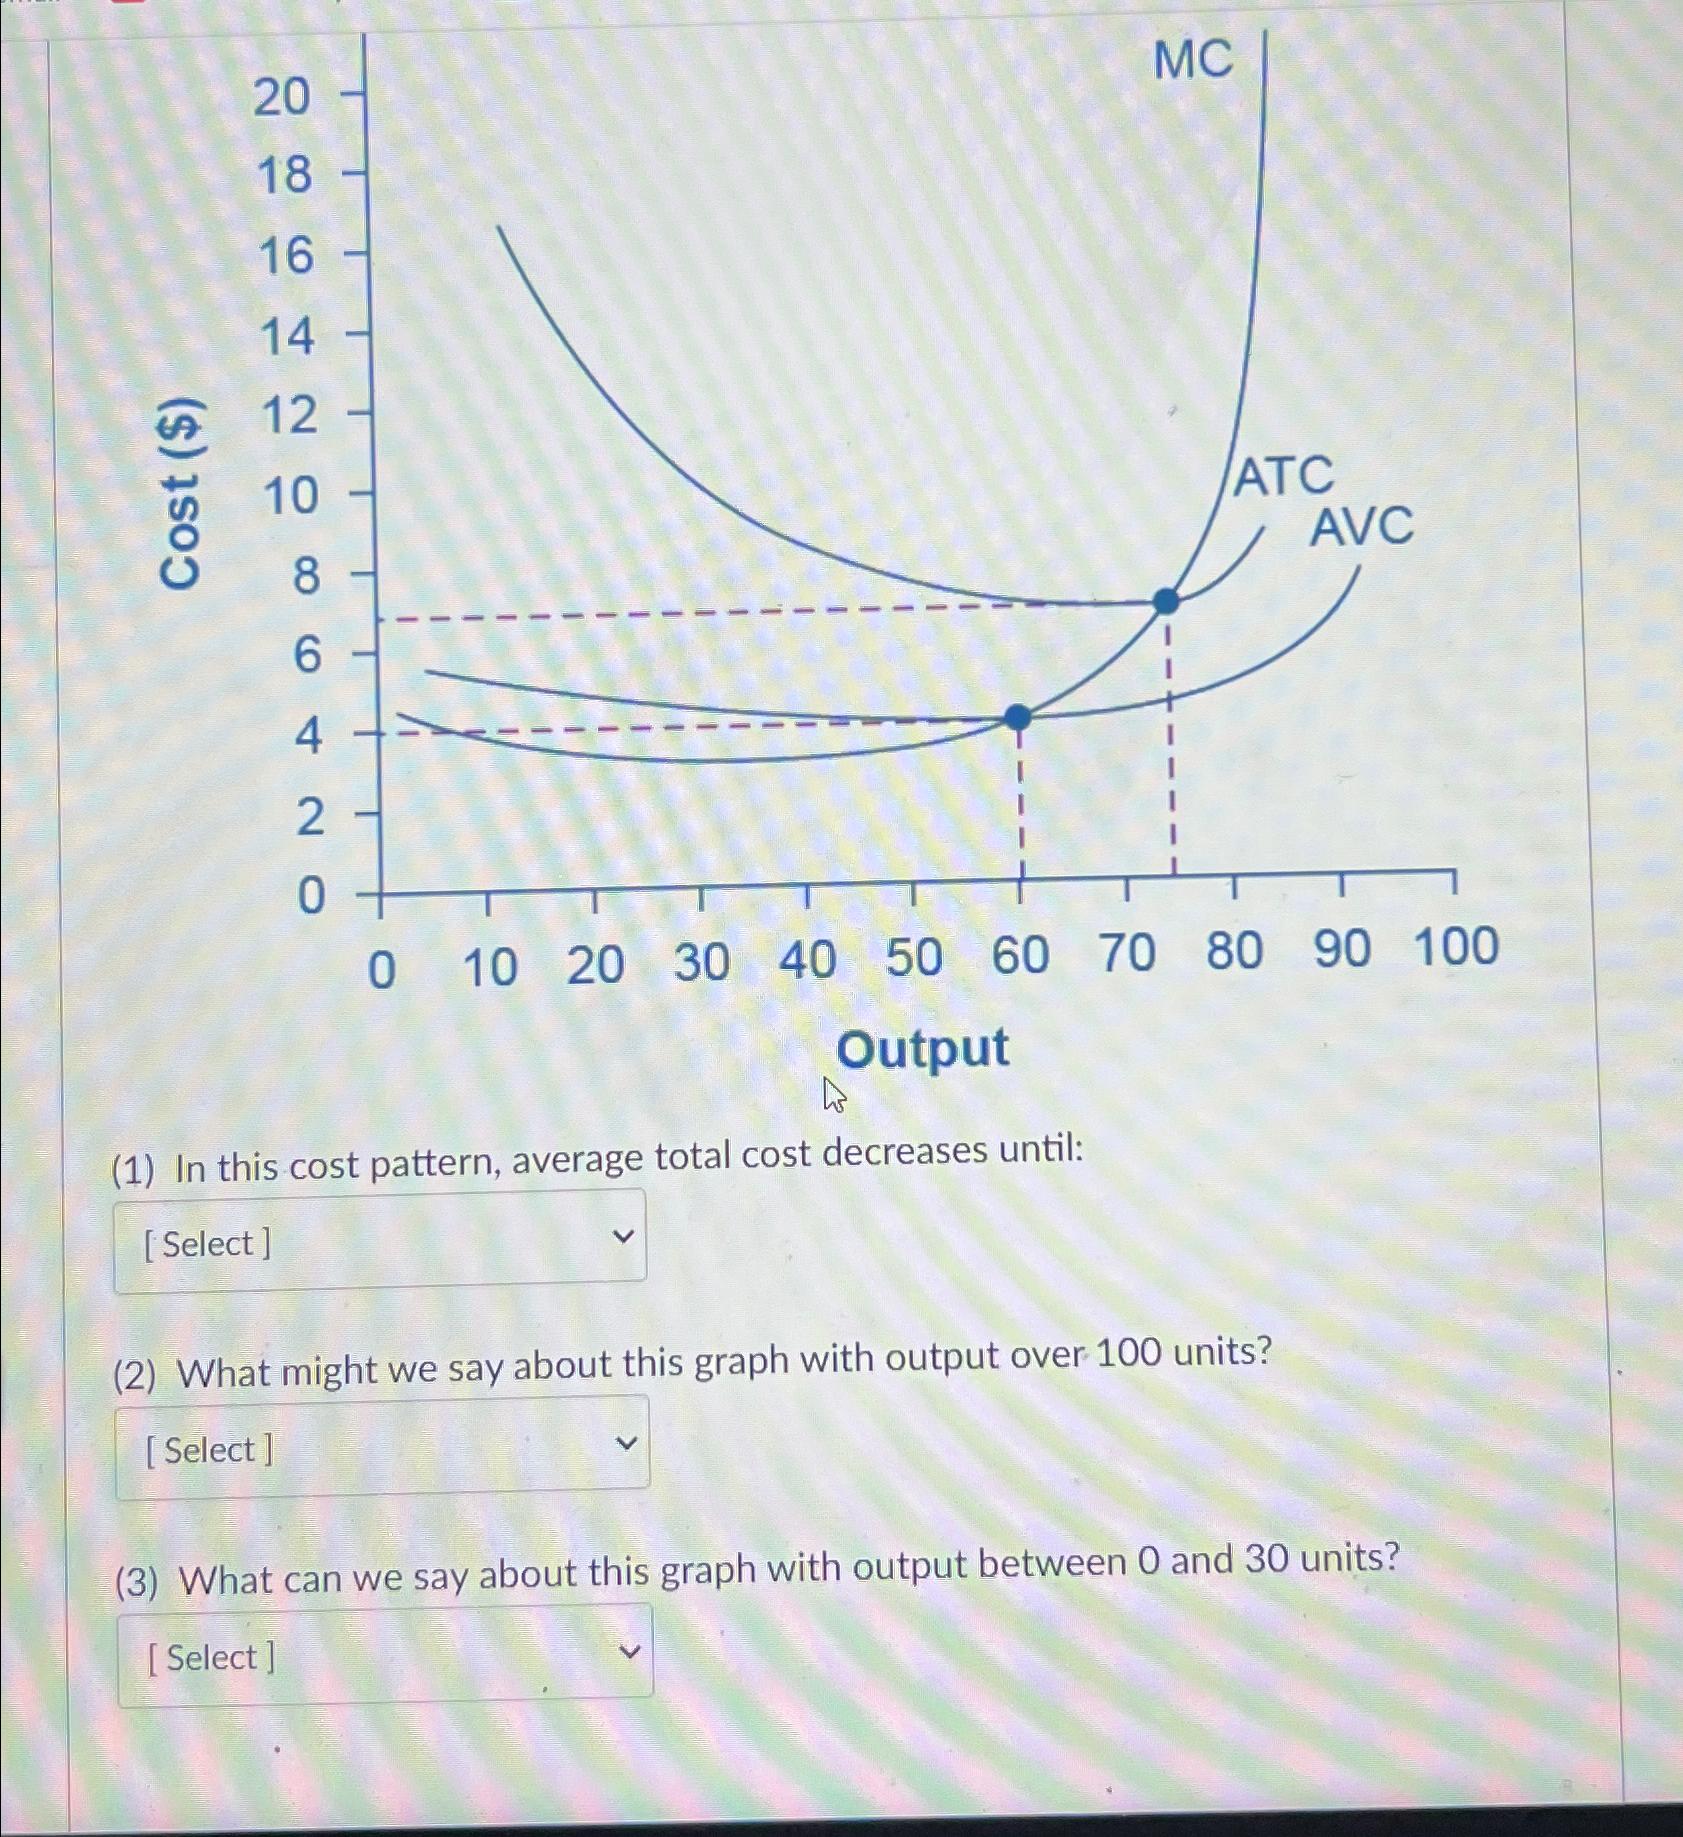
Question: ( 1 ) In this cost pattern, average total cost decreases until: ( 2 ) What might we say about this graph with output over
In this cost pattern, average total cost decreases until:
What might we say about this graph with output over units?
What can we say about this graph with output between and units?
Step by Step Solution
There are 3 Steps involved in it
1 Expert Approved Answer
Step: 1 Unlock

Question Has Been Solved by an Expert!
Get step-by-step solutions from verified subject matter experts
Step: 2 Unlock
Step: 3 Unlock