

1. In this part you will find the unique degree 20 polynomial that interpolates the 21...
Fantastic news! We've Found the answer you've been seeking!
Question:
Transcribed Image Text:
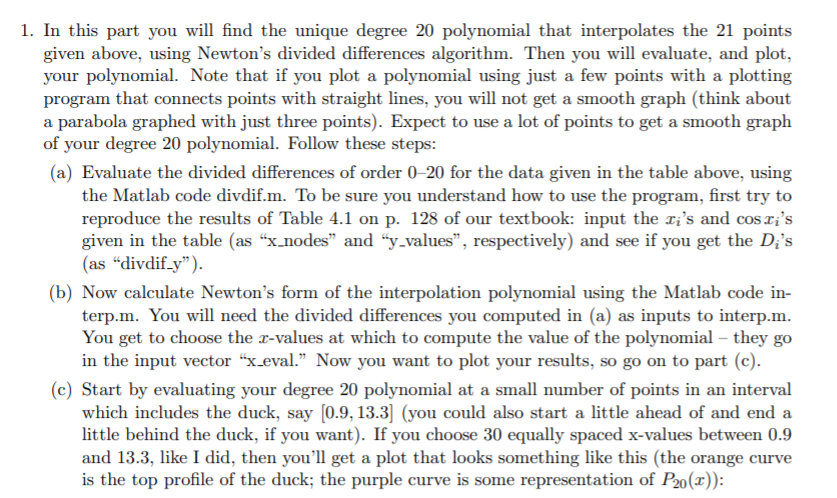
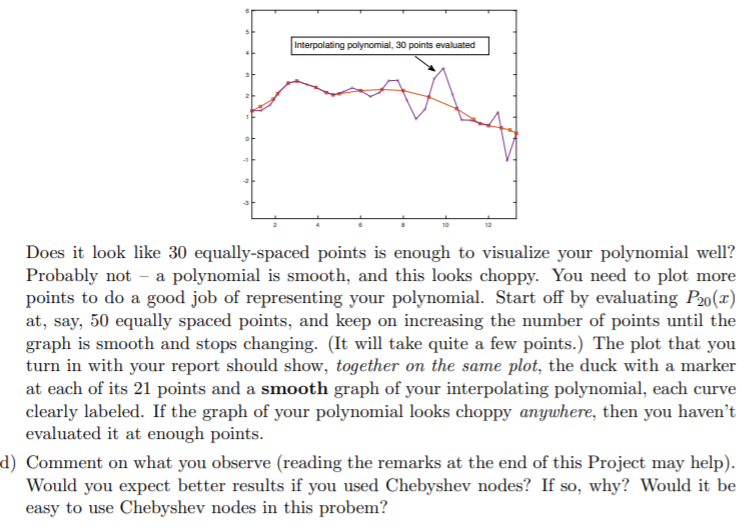
1. In this part you will find the unique degree 20 polynomial that interpolates the 21 points given above, using Newton's divided differences algorithm. Then you will evaluate, and plot, your polynomial. Note that if you plot a polynomial using just a few points with a plotting program that connects points with straight lines, you will not get a smooth graph (think about a parabola graphed with just three points). Expect to use a lot of points to get a smooth graph of your degree 20 polynomial. Follow these steps: (a) Evaluate the divided differences of order 0-20 for the data given in the table above, using the Matlab code divdif.m. To be sure you understand how to use the program, first try to reproduce the results of Table 4.1 on p. 128 of our textbook: input the ri's and cosi's given in the table (as "x_nodes" and "y_values", respectively) and see if you get the Di's (as divdif_y"). (b) Now calculate Newton's form of the interpolation polynomial using the Matlab code in- terp.m. You will need the divided differences you computed in (a) as inputs to interp.m. You get to choose the r-values at which to compute the value of the polynomial - they go in the input vector "x_eval." Now you want to plot your results, so go on to part (c). (c) Start by evaluating your degree 20 polynomial at a small number of points in an interval which includes the duck, say [0.9, 13.3] (you could also start a little ahead of and end a little behind the duck, if you want). If you choose 30 equally spaced x-values between 0.9 and 13.3, like I did, then you'll get a plot that looks something like this (the orange curve is the top profile of the duck; the purple curve is some representation of P20(x)): Interpolating polynomial, 30 points evaluated Does it look like 30 equally-spaced points is enough to visualize your polynomial well? Probably not a polynomial is smooth, and this looks choppy. You need to plot more points to do a good job of representing your polynomial. Start off by evaluating P20(x) at, say, 50 equally spaced points, and keep on increasing the number of points until the graph is smooth and stops changing. (It will take quite a few points.) The plot that you turn in with your report should show, together on the same plot, the duck with a marker at each of its 21 points and a smooth graph of your interpolating polynomial, each curve clearly labeled. If the graph of your polynomial looks choppy anywhere, then you haven't evaluated it at enough points. d) Comment on what you observe (reading the remarks at the end of this Project may help). Would you expect better results if you used Chebyshev nodes? If so, why? Would it be easy to use Chebyshev nodes in this probem? 1. In this part you will find the unique degree 20 polynomial that interpolates the 21 points given above, using Newton's divided differences algorithm. Then you will evaluate, and plot, your polynomial. Note that if you plot a polynomial using just a few points with a plotting program that connects points with straight lines, you will not get a smooth graph (think about a parabola graphed with just three points). Expect to use a lot of points to get a smooth graph of your degree 20 polynomial. Follow these steps: (a) Evaluate the divided differences of order 0-20 for the data given in the table above, using the Matlab code divdif.m. To be sure you understand how to use the program, first try to reproduce the results of Table 4.1 on p. 128 of our textbook: input the ri's and cosi's given in the table (as "x_nodes" and "y_values", respectively) and see if you get the Di's (as divdif_y"). (b) Now calculate Newton's form of the interpolation polynomial using the Matlab code in- terp.m. You will need the divided differences you computed in (a) as inputs to interp.m. You get to choose the r-values at which to compute the value of the polynomial - they go in the input vector "x_eval." Now you want to plot your results, so go on to part (c). (c) Start by evaluating your degree 20 polynomial at a small number of points in an interval which includes the duck, say [0.9, 13.3] (you could also start a little ahead of and end a little behind the duck, if you want). If you choose 30 equally spaced x-values between 0.9 and 13.3, like I did, then you'll get a plot that looks something like this (the orange curve is the top profile of the duck; the purple curve is some representation of P20(x)): Interpolating polynomial, 30 points evaluated Does it look like 30 equally-spaced points is enough to visualize your polynomial well? Probably not a polynomial is smooth, and this looks choppy. You need to plot more points to do a good job of representing your polynomial. Start off by evaluating P20(x) at, say, 50 equally spaced points, and keep on increasing the number of points until the graph is smooth and stops changing. (It will take quite a few points.) The plot that you turn in with your report should show, together on the same plot, the duck with a marker at each of its 21 points and a smooth graph of your interpolating polynomial, each curve clearly labeled. If the graph of your polynomial looks choppy anywhere, then you haven't evaluated it at enough points. d) Comment on what you observe (reading the remarks at the end of this Project may help). Would you expect better results if you used Chebyshev nodes? If so, why? Would it be easy to use Chebyshev nodes in this probem?
Expert Answer:

Related Book For 

Mathematical Statistics With Applications In R
ISBN: 9780124171138
2nd Edition
Authors: Chris P. Tsokos, K.M. Ramachandran
Posted Date:
Students also viewed these databases questions
-
Let A, B be sets. Define: (a) the Cartesian product (A B) (b) the set of relations R between A and B (c) the identity relation A on the set A [3 marks] Suppose S, T are relations between A and B, and...
-
the Q question 1)Building a MultiThreaded Web Server In this lab we will develop a Web server in two steps. In the end, you will have built a multithreaded Web server that is capable of processing...
-
In the figure shown the block is given along the block Small of the displacement 's motion system is lying on table). of the a spring 3.. Equation_
-
On reviewing the financial statements, the company accountant discovers that there has been no provision made for urgent repairs to external doors and window frames, already identified as being of...
-
At the beginning of the current season on April 1, the ledger of Five Pines Pro Shop showed Cash $3,000; Merchandise Inventory $4,000; and Irene Tiger, Capital $7,000.These transactions occurred...
-
For each of the following, calculate the degrees of freedom \((d f)\) and determine the critical values of \(t\) (assume \(\mathrm{a}=.05\) ). a. N =21, N2 = 21, H: H H1 H1* H2 b. N 14, N = 14, H1 H1...
-
Deines Company accumulates the following data concerning a mixed cost, using miles as the activity level. Compute the variable and fixed cost elements using the high-low method. Miles Driven 8,000...
-
1. In the election shown below under the Plurality method, explain why voters in the third column might be inclined to vote insincerely. How could it affect the outcome of the election? Number of...
-
Halifax Manufacturing allows its customers to return merchandise for any reason and receive a credit to their accounts. All of Halifax's sales are for credit (no cash is collected at the time of...
-
3-3 An electrical power plant is a system governed by the First Law of Thermo- dynamics. Enough coal is fed to the plant every hour to generate 1,000,000 Btu of Heat. The output from the plant is...
-
1. Current Flow The two figures below show two separate circuit diagrams. The circles with A1 and A2 represent two identical ammeters (devices that measure current). The circles with an X in them...
-
1. A stainless steel spoon (k = 15 W/m-K) is partially immersed in boiling water at 100C in a kitchen at 20C. The handle of the spoon has a cross section of 2 mm 10 mm and extends 150 mm in the air...
-
Suppose that a put contract which is written on a stock currently has a premium of 3 TL per share. This option has 3 month remaining to maturity and has an exercise price 2 8 while the stock on which...
-
Air in a 138-km/h wind strikes head-on the face of a building 45 m wide by 73 m high and is brought to rest. if air has a mass of 1.3 kg per cubic meter, determine the average force of the wind on...
-
A force applied to a spring compresses the spring 13 cm, storing a certain amount of elastic potential energy. Then a larger force is applied to compress the spring a total of 52 cm. How does the...
-
The Particle Accelerator LHC (Large Hadron Collider) at the International Particle Physics Research Organization CERN in Switzerland uses superconducting magnets to carry protons in a circular orbit...
-
Give codons for the following amino acids: (a) Th (b) Asp (c) Thr
-
In an effort to study the effect of four different preventive maintenance programs on downtimes (in minutes) for a certain period of time in a production line, a factory runs four parallel production...
-
In sociology, a social network is defined as the people you make frequent contact with, say through Facebook. The personal network size for each adult in a random sample of 3000 adults was...
-
Find k so that f(x, y) = kxy, 1 x y 2 will be a probability density function. Also find (i) P X 3/2, Y 3/2), (ii) P X + Y 3/2).
-
Consider the following observations: a. Fit the nonlinear regression model \[ y=\theta_{1} e^{\theta_{2} x}+\varepsilon \] to these data. Discuss how you obtained the starting values. b. Test for...
-
For the models shown below, determine whether it is a linear model, an intrinsically linear model, or a nonlinear model. If the model is intrinsically linear, show how it can be linearized by a...
-
Sketch the expectation function for the logistic growth model (12.34) for \(\theta_{1}=1, \theta_{3}=1\), and values of \(\theta_{2}=1,4,8\), respectively. Overlay these plots on the same \(x-y\)...

Study smarter with the SolutionInn App