

Question: 1. In Weather sheet, create a combination chart involving a column and line graph with a secondary axis to chart the temperature and rainfall data.
1. In "Weather" sheet, create a combination chart involving a column and line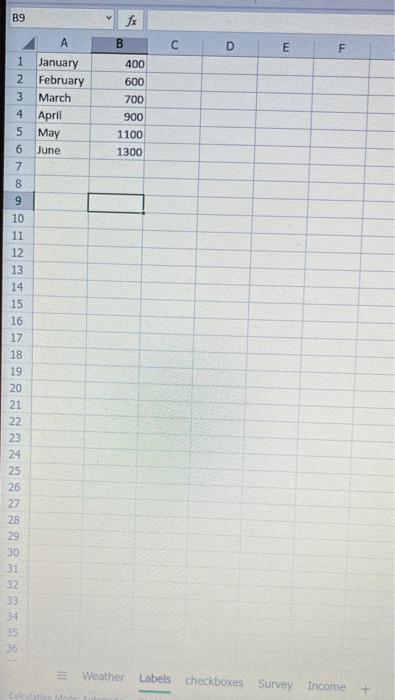
Fire Home Insen Draw Page Layout Formulas abc Spelling Workbook Statistics Check Accessibility Chart 1 fx D E F 5 April 6 May 8 July B 1 Temperatu Rainfall 2 January 35 0.8 3 February 36 0.7 4 March 46 0.6 57 0.5 71 0.4 7 June 81 0.3 84 0.2 9 August 86 0.1 10 Septembe 83 0.4 11 October 69 0.5 12 November 52 0.6 13 December 33 0.7 14 15 16 17 18 19 20 21 22 23 99 SNUSSSSS 24 25 26 22 28 29 30 31 32 Weather behobor Sny income B9 fx B D E E F 1 2 3 January February March April May June 400 600 700 900 1100 1300 4 7 8 9 10 11 12 13 14 15 16 17 18 19 20 21 22 23 24 25 26 27 28 29 30 31 32 33 34 35 36 Weather Labels checkboxes Survey Income + January February March April May 2010 200 58 128 92 2011 123 121 135 141 June 166 94 July 179 59 72 105 + Weather Labelscheckboxes Survey Income Fire Home Insen Draw Page Layout Formulas abc Spelling Workbook Statistics Check Accessibility Chart 1 fx D E F 5 April 6 May 8 July B 1 Temperatu Rainfall 2 January 35 0.8 3 February 36 0.7 4 March 46 0.6 57 0.5 71 0.4 7 June 81 0.3 84 0.2 9 August 86 0.1 10 Septembe 83 0.4 11 October 69 0.5 12 November 52 0.6 13 December 33 0.7 14 15 16 17 18 19 20 21 22 23 99 SNUSSSSS 24 25 26 22 28 29 30 31 32 Weather behobor Sny income B9 fx B D E E F 1 2 3 January February March April May June 400 600 700 900 1100 1300 4 7 8 9 10 11 12 13 14 15 16 17 18 19 20 21 22 23 24 25 26 27 28 29 30 31 32 33 34 35 36 Weather Labels checkboxes Survey Income + January February March April May 2010 200 58 128 92 2011 123 121 135 141 June 166 94 July 179 59 72 105 + Weather Labelscheckboxes Survey Income
graph with a secondary axis to chart the temperature and rainfall data.
2. In "Label" sheet, create a bar chart with tomato picture with 200 units/Tomato
(Picture).
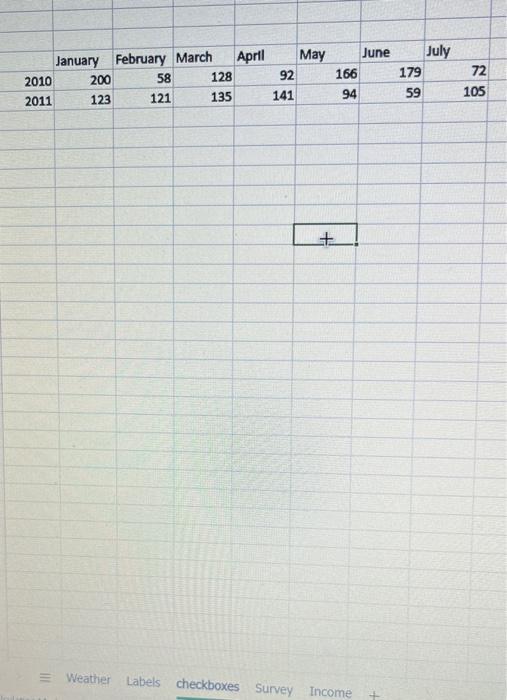
3. In "Checkboxes" sheet, please create checkboxes for 2010 and 2011, separately.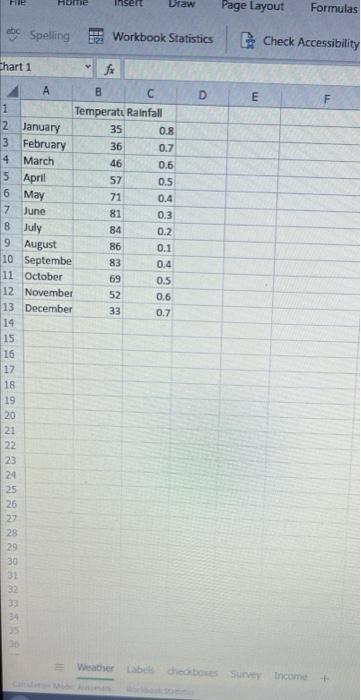
Then checkboxes will control whether the data will be shown on a line chart.
Step by Step Solution
There are 3 Steps involved in it
1 Expert Approved Answer
Step: 1 Unlock

Question Has Been Solved by an Expert!
Get step-by-step solutions from verified subject matter experts
Step: 2 Unlock
Step: 3 Unlock