

Question: 1. Include a screenshot image below of your simulation from the M&M simulator. 2. Complete this table with your filings (Round decimals to the
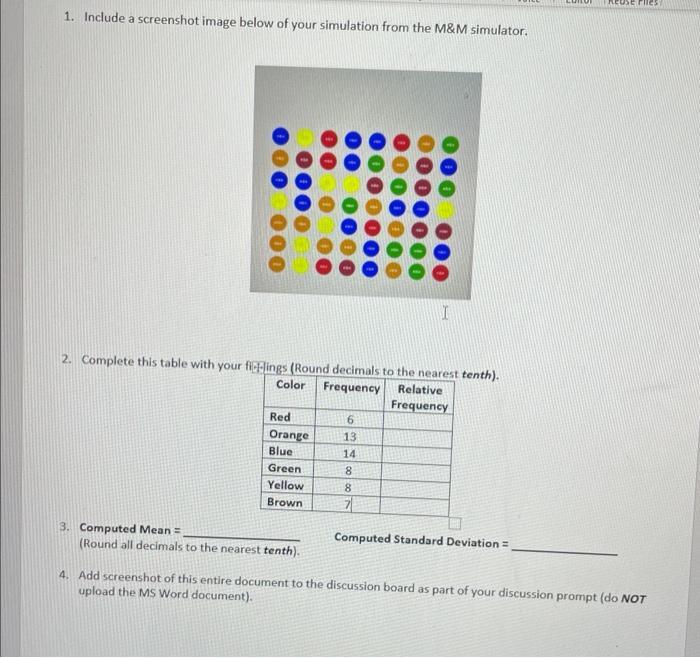
1. Include a screenshot image below of your simulation from the M&M simulator. 2. Complete this table with your filings (Round decimals to the nearest tenth). Relative Frequency Color Frequency Red Orange Blue Green Yellow Brown 3. Computed Mean = (Round all decimals to the nearest tenth). 6 13 14 8 8 I 7 Computed Standard Deviation = TREUSE Files 4. Add screenshot of this entire document to the discussion board as part of your discussion prompt (do NOT upload the MS Word document).
Step by Step Solution
3.28 Rating (148 Votes )
There are 3 Steps involved in it
Calculate the relative frequency for each color by dividing the frequency of each color by the total ... View full answer

Get step-by-step solutions from verified subject matter experts