Question: 1. Inferences about the difference between two population means - Independent samples, population standard deviations known and Study Tools Consider a pool of home mortgages.
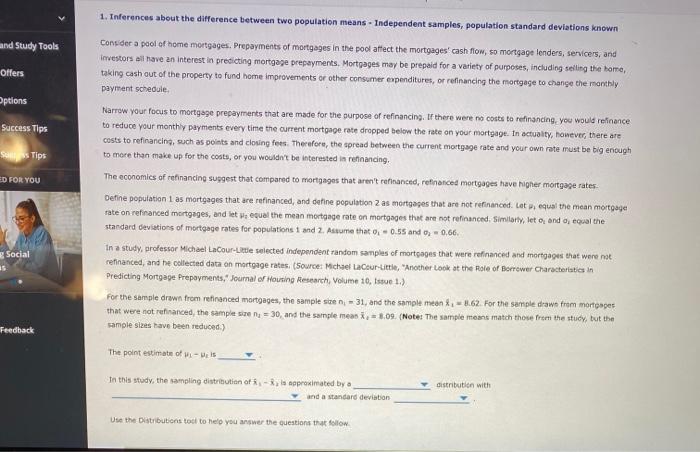
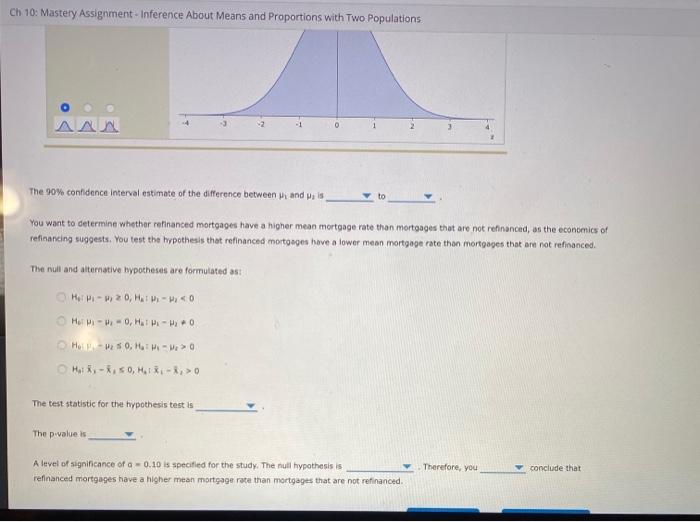
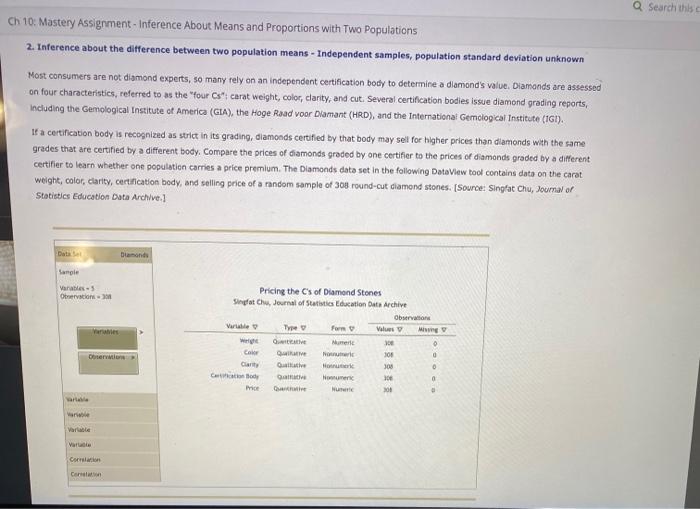
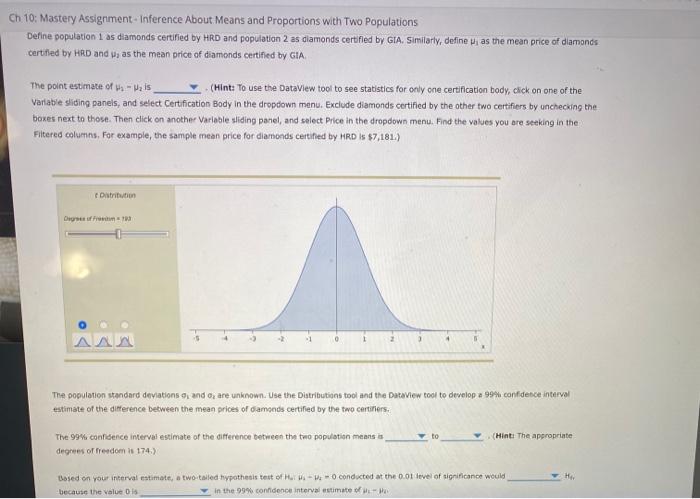
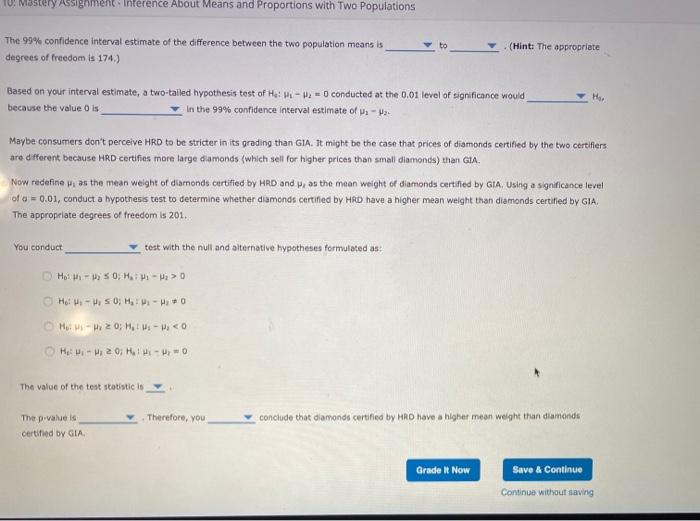
1. Inferences about the difference between two population means - Independent samples, population standard deviations known and Study Tools Consider a pool of home mortgages. Prepayments of mortgages in the pool affect the mortgages' cash flow, so mortgage lenders, servicers, and Investors all have an interest in predicting mortgage prepayments. Mortgages may be prepaid for a variety of purposes, including selling the home, taking cash out of the property to fund home improvements or other consumer expenditures, or refinancing the mortgage to change the monthly payment schedule. Offers Options Success Tips Narrow your focus to mortgage prepayments that are made for the purpose of refinancing. If there were no costs to refinancing, you would refinance to reduce your monthly payments every time the current mortgage rate dropped below the rate on your mortgage. In actualty, however, there are costs to refinancing, such as points and closing fees. Therefore, the spread between the current mortgage rate and your own rate must be big enough to more than make up for the costs, or you wouldn't be interested in refinancing Ses Tips ED FOR YOU The economics of refinancing suggest that compared to mortgages that aren't refinanced, refinanced mortgages have higher mortgage rates. Social 15 Define population 1 as mortgages that are refinanced, and define population 2 as mortgages that are not refinanced. Let , equal the mean mortgage rate on refinanced mortgages, and let equal the mean mortgage rate on mortgages that are not refinanced. Similarly, let and equal the standard deviations of mortgage rates for populations 1 and 2. Assume that 0, -0.55 and 0, 0,66. In a study, professor Michael LaCour-Little selected independent random samples of mortgages that were refinanced and mortgages that were not refinanced, and he collected data on mortgage rates. (Source: Michael La CourLittle, "Another Look at the Role of Borrower Characteristics in Predicting Mortgage Prepayments." Journal of Housing Research, Volume 10, Issue 1.) For the sample drawn from refinanced mortgages, the sample stren-31, and the sample mean 3.62. For the sample drawn from mortopes that were not refinanced, the sample size na = 30, and the sample meani-3.09 (Note: The sample means match those from the study, but the sample sizes have been reduced.) Feedback The point estimate of Wils In this study, the sampling distribution of - ls proximated by and a standard deviation distribution with Use the Distributions tool to help you answer the questions that follow Ch 10: Mastery Assignment-Inference About Means and Proportions with Two Populations aan 3 The 90% confidence interval estimate of the difference between 1 and is You want to determine whether refinanced mortgages have a higher mean mortgage rate than mortgages that are not refinanced, as the economics of refinancing suggests. You test the hypothesis that refinanced mortgages have a lower mean mortgage rate than mortgages that are not refinanced. The null and alternative hypotheses are formulated as H-20, H1 - 0 H--0,1 - 0 H-SOHIH-W.> 0 H-X, 50, HR-> The test statistic for the hypothesis test is The value is A level of significance of 0.10 is specified for the study. The null hypothesis is refinanced mortgages have a higher mean mortgage rate than mortgages that are not refinanced Therefore, you conclude that Search this Ch 10: Mastery Assignment - Inference About Means and Proportions with Two Populations 2. Inference about the difference between two population means - Independent samples, population standard deviation unknown Most consumers are not diamond experts, so many rely on an independent certification body to determine a diamond's value. Diamonds are assessed on four characteristics, referred to as the "four Cs": carat weight, color, clarity, and cut. Several certification bodies issue diamond grading reports, Including the Gemological Institute of America (GIA), the Hoge Raad voor Dlamant (HRD), and the International Gemological Institute (IGT). If a certification body is recognized as strict in its grading, diamonds certified by that body may set for higher prices than diamonds with the same grades that are certified by a different body. Compare the prices of diamonds graded by one certifier to the prices of diamonds graded by a different certifier to learn whether one population carries a price premium. The Diamonds data set in the following DataView tool contains data on the carat weight, color, clarity, certification body, and selling price of a random sample of 30 round-cut diamond stones. (Source: Singfat Chu, Journal of Statistics Education Data Archive] Data Donds Sample Varables Observation Pricing the Cs of Diamond Stones Sinfot Chu, Journal of Statistics Education Data Archive Observation Variable Valu v wrig GE 30 Coor QRV Now 308 0 Care Date House 300 Date Home 30 0 Price NU 201 One Warwo V Correlation Ch 10: Mastery Assignment Inference About Means and Proportions with Two Populations Define population 1 as diamonds certified by HRD and population 2 as diamonds certified by GIA. Similarly, define as the mean price of diamonds certified by HRD and was the mean price of diamonds certified by GIA The point estimate of us - Mais (Hint: To use the Dataview tool to see statistics for only one certification body, click on one of the Variable sliding panels, and select Certification Body in the dropdown menu. Exclude diamonds certified by the other two certifiers by unchecking the boxes next to those. Then click on another Variable sliding panel, and select Price in the dropdown menu. Find the values you are seeking in the Filtered columns. For example, the sample mean price for diamonds certified by HRD IS $7,181.) Ostron The population standard deviations, and are unknown. Use the Distribution tool and the Dataview tool to develop a 99% confidence interval estimate of the difference between the mean prices of Gameds certified by the two certifiers. to (Hint: The appropriate The 99% confidence interval estimate of the difference between the two population means is degrees of freedom i 174.) Based on your interval estimate, a two-tailed hypothesis tout of conducted at the 0.01 level of significance would because the value os in the 99% confidence interval estimate of - 10: Mastery Assignment Inference About Means and Proportions with Two Populations The 99% confidence interval estimate of the difference between the two population means is degrees of freedom is 174.) to (Hint: The appropriate Based on your interval estimate, a two-talled hypothesis test of He:- = conducted at the 0.01 level of significance would because the value os In the 99% confidence interval estimate of a Maybe consumers don't perceive HRD to be stricter in its grading than GIA. It might be the case that prices of diamonds certified by the two certifiers are different because HRD certifies more large diamonds (which sell for higher prices than small diamonds) than GIA. Now redefine as the mean weight of diamonds certified by HRD and was the man weight of diamonds certified by GIA. Using a significance level of a = 0.01, conduct a hypothesis test to determine whether diamonds certified by HRD have a higher mean weight than diamonds certified by GIA The appropriate degrees of freedom is 201. You conduct test with the null and alternative hypotheses formulated as: Mo-SOHP - 20 CH-, SO; HW-0 H Vi - H = 0; 4, Mi - P 0 H-X, 50, HR-> The test statistic for the hypothesis test is The value is A level of significance of 0.10 is specified for the study. The null hypothesis is refinanced mortgages have a higher mean mortgage rate than mortgages that are not refinanced Therefore, you conclude that Search this Ch 10: Mastery Assignment - Inference About Means and Proportions with Two Populations 2. Inference about the difference between two population means - Independent samples, population standard deviation unknown Most consumers are not diamond experts, so many rely on an independent certification body to determine a diamond's value. Diamonds are assessed on four characteristics, referred to as the "four Cs": carat weight, color, clarity, and cut. Several certification bodies issue diamond grading reports, Including the Gemological Institute of America (GIA), the Hoge Raad voor Dlamant (HRD), and the International Gemological Institute (IGT). If a certification body is recognized as strict in its grading, diamonds certified by that body may set for higher prices than diamonds with the same grades that are certified by a different body. Compare the prices of diamonds graded by one certifier to the prices of diamonds graded by a different certifier to learn whether one population carries a price premium. The Diamonds data set in the following DataView tool contains data on the carat weight, color, clarity, certification body, and selling price of a random sample of 30 round-cut diamond stones. (Source: Singfat Chu, Journal of Statistics Education Data Archive] Data Donds Sample Varables Observation Pricing the Cs of Diamond Stones Sinfot Chu, Journal of Statistics Education Data Archive Observation Variable Valu v wrig GE 30 Coor QRV Now 308 0 Care Date House 300 Date Home 30 0 Price NU 201 One Warwo V Correlation Ch 10: Mastery Assignment Inference About Means and Proportions with Two Populations Define population 1 as diamonds certified by HRD and population 2 as diamonds certified by GIA. Similarly, define as the mean price of diamonds certified by HRD and was the mean price of diamonds certified by GIA The point estimate of us - Mais (Hint: To use the Dataview tool to see statistics for only one certification body, click on one of the Variable sliding panels, and select Certification Body in the dropdown menu. Exclude diamonds certified by the other two certifiers by unchecking the boxes next to those. Then click on another Variable sliding panel, and select Price in the dropdown menu. Find the values you are seeking in the Filtered columns. For example, the sample mean price for diamonds certified by HRD IS $7,181.) Ostron The population standard deviations, and are unknown. Use the Distribution tool and the Dataview tool to develop a 99% confidence interval estimate of the difference between the mean prices of Gameds certified by the two certifiers. to (Hint: The appropriate The 99% confidence interval estimate of the difference between the two population means is degrees of freedom i 174.) Based on your interval estimate, a two-tailed hypothesis tout of conducted at the 0.01 level of significance would because the value os in the 99% confidence interval estimate of - 10: Mastery Assignment Inference About Means and Proportions with Two Populations The 99% confidence interval estimate of the difference between the two population means is degrees of freedom is 174.) to (Hint: The appropriate Based on your interval estimate, a two-talled hypothesis test of He:- = conducted at the 0.01 level of significance would because the value os In the 99% confidence interval estimate of a Maybe consumers don't perceive HRD to be stricter in its grading than GIA. It might be the case that prices of diamonds certified by the two certifiers are different because HRD certifies more large diamonds (which sell for higher prices than small diamonds) than GIA. Now redefine as the mean weight of diamonds certified by HRD and was the man weight of diamonds certified by GIA. Using a significance level of a = 0.01, conduct a hypothesis test to determine whether diamonds certified by HRD have a higher mean weight than diamonds certified by GIA The appropriate degrees of freedom is 201. You conduct test with the null and alternative hypotheses formulated as: Mo-SOHP - 20 CH-, SO; HW-0 H Vi - H = 0; 4, Mi - P