Question: 1. Introduction The problem being addressed in this project is the relationship between the total number of wins for NBA teams in a regular season
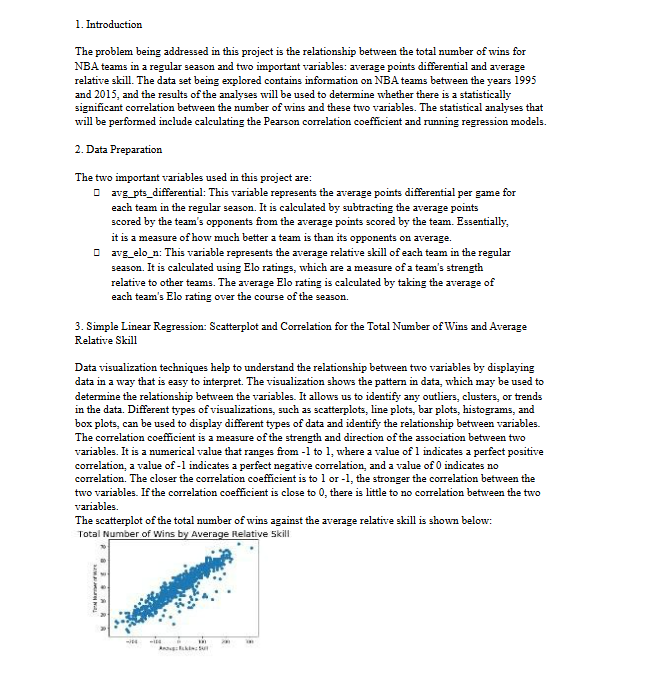
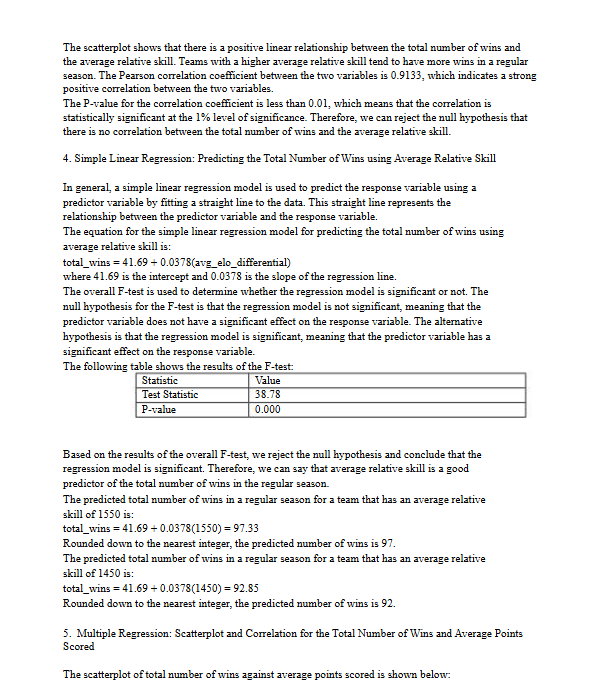
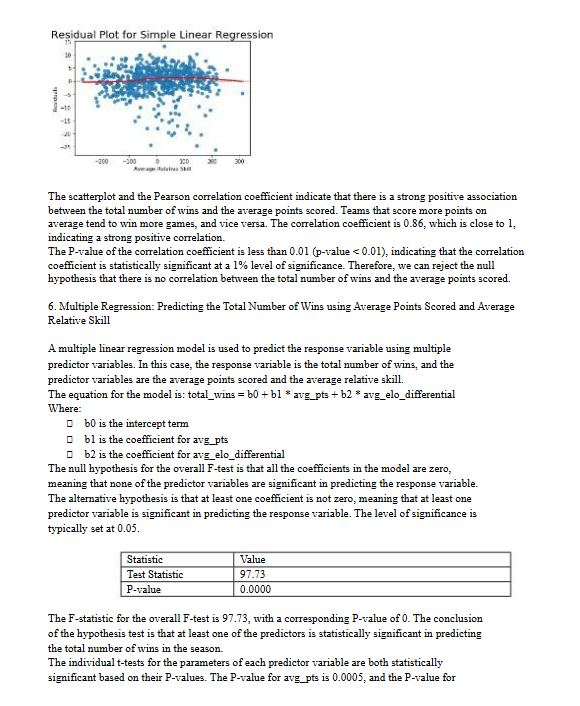
1. Introduction The problem being addressed in this project is the relationship between the total number of wins for NBA teams in a regular season and two important variables: average points differential and average relative skill. The data set being explored contains information on NBA teams between the years 1995 and 2015, and the results of the analyses will be used to determine whether there is a statistically significant correlation between the number of wins and these two variables. The statistical analyses that will be performed include calculating the Pearson correlation coefficient and running regression models. 2. Data Preparation The two important variables used in this project are: 0 avg_pts_differential: This variable represents the average points differential per game for each team in the regular season. It is calculated by subtracting the average points scored by the team's opponents from the average points scored by the team. Essentially, it is a measure of how much better a team is than its opponents on average 0 avg_elo_n: This variable represents the average relative skill of each team in the regular season. It is calculated using Elo ratings, which are a measure of a team's strength relative to other teams. The average Elo rating is calculated by taking the average of each team's Elo rating over the course of the season. 3. Simple Linear Regression: Scatterplot and Correlation for the Total Number of Wins and Average Relative Skill Data visualization techniques help to understand the relationship between two variables by displaying data in a way that is easy to interpret. The visualization shows the pattern in data, which may be used to determine the relationship between the variables. It allows us to identify any outliers, clusters, or trends in the data. Different types of visualizations, such as scatterplots, line plots, bar plots, histograms, and box plots, can be used to display different types of data and identify the relationship between variables. The correlation coefficient is a measure of the strength and direction of the association between two variables. It is a numerical value that ranges from -1 to 1, where a value of 1 indicates a perfect positive correlation, a value of -1 indicates a perfect negative correlation, and a value of 0 indicates no correlation. The closer the correlation coefficient is to 1 or -1, the stronger the correlation between the two variables. If the correlation coefficient is close to 0, there is little to no correlation between the two variables. The scatterplot of the total number of wins against the average relative skill is shown below: Total Number of Wins by Average Relative SkillThe scatterplot shows that there is a positive Imear relationship between the total number of wins and the average relative skill. Teams with a higher average relative skill tend to have more wins in a regular season. The Pearson correlation coefficient between the two variables is 0.9133, which indicates a strong positive correlation between the two variables The P-value for the correlation coefficient is less than 0.01, which means that the correlation is statistically significant at the 1% level of significance. Therefore, we can reject the null hypothesis that there is no correlation between the total number of wins and the average relative skill. 4. Simple Linear Regression: Predicting the Total Number of Wins using Average Relative Skill In general, a simple linear regression model is used to predict the response variable using a predictor variable by fitting a straight line to the data. This straight line represents the relationship between the predictor variable and the response variable. The equation for the simple linear regression model for predicting the total number of wins using average relative skill is: total_wins = 41.69 + 0.0378(avg_elo_differential) where 41.69 is the intercept and 0.0378 is the slope of the regression line The overall F-test is used to determine whether the regression model is significant or not. The null hypothesis for the F-test is that the regression model is not significant, meaning that the predictor variable does not have a significant effect on the response variable. The alternative hypothesis is that the regression model is significant, meaning that the predictor variable has a significant effect on the response variable. The following table shows the results of the F-test: Statistic Value Test Statistic 38.78 P-value 0.000 Based on the results of the overall F-test, we reject the null hypothesis and conclude that the regression model is significant. Therefore, we can say that average relative skill is a good predictor of the total number of wins in the regular season. The predicted total number of wins in a regular season for a team that has an average relative skill of 1550 is: total_wins = 41.69 + 0.0378(1550) = 97.33 Rounded down to the nearest integer, the predicted number of wins is 97. The predicted total number of wins in a regular season for a team that has an average relative skill of 1450 is: total_wins = 41.69 + 0.0378(1450) = 92.85 Rounded down to the nearest integer, the predicted number of wins is 92. 5. Multiple Regression: Scatterplot and Correlation for the Total Number of Wins and Average Points Scored The scatterplot of total number of wins against average points scored is shown below:Residual Plot for Simple Linear Regression -tin -200 -300 300 Average Aulatren Still The scatterplot and the Pearson correlation coefficient indicate that there is a strong positive association between the total number of wins and the average points scored. Teams that score more points on average tend to win more games, and vice versa. The correlation coefficient is 0.86, which is close to 1, indicating a strong positive correlation. The P-value of the correlation coefficient is less than 0.01 (p-value
Step by Step Solution
There are 3 Steps involved in it
1 Expert Approved Answer
Step: 1 Unlock
Question Has Been Solved by an Expert!
Get step-by-step solutions from verified subject matter experts
Step: 2 Unlock
Step: 3 Unlock
Students Have Also Explored These Related Mathematics Questions!