

Question: 1. Label the following sheetsDocumentation, Variables, Worksheet 2. Documentation: Your name, name of the problem, and date 3. Variables: All numbers given in the problem.
1. Label the following sheetsDocumentation, Variables, Worksheet
2. Documentation: Your name, name of the problem, and date
3. Variables: All numbers given in the problem. You will need all the variables to prepare the worksheets. Organize your variables using the following table listed in point 4.
4. Prepare a scatter diagram. A) Enter the table in the P6-6A in your Variables Sheet and add variables. For example,
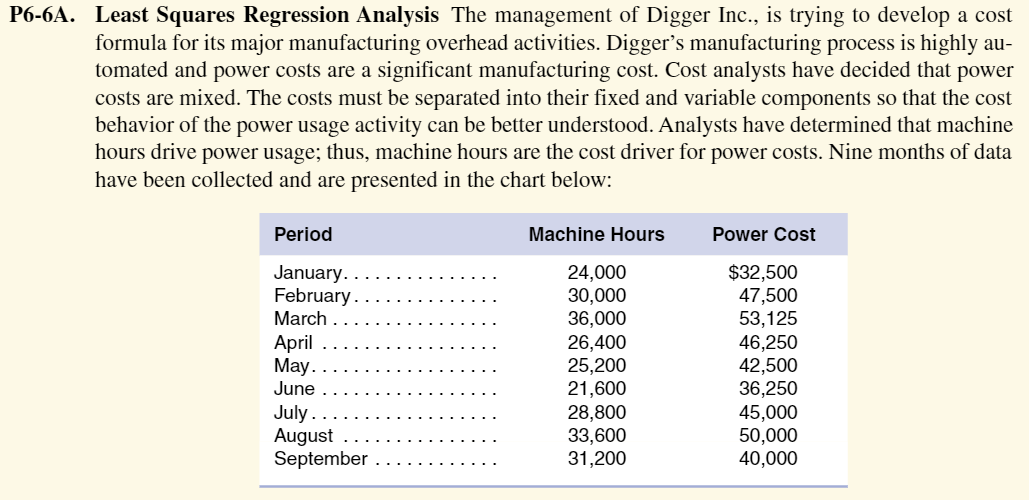
MonthMachine HoursPower CostJanuary24,000$32,500
B) Highlight the table (Do not highlight the month!) and insert a scatter diagram.
Select INSERTselect scatter diagramselect the picture of points without a line from the ribbon.
Select Select Chart Element (far left)
o Select Chart title (above chart) and enter title
o Select Axis titles and label x and y-axis
o Select Legend (turn off)
o Select Trendlineselect more options (right arrow next to Trendline)
Put a check in the check box for Display R-squared
Put check in the check box for Display equation
Right-click on the margin of the graph (It is outside the graph area but on the sheet)
o Select Move chart
o Name chart Scatter Diagram (This will set a sheet titled Scatter Diagram)
5. Worksheet: Follow this format:
Comparison Table
HiLo Regression Variable cost per unit NOTE: You cannot link from the equation on the Scatter Diagram. Just enter the number. Fixed cost NOTE: You cannot link from the equation on the Scatter Diagram. Just enter the number. Total cost at 26,700 hours
6. Link variables to the worksheet for the HiLo method and enter the variable for the regression table by hand. Formulas can be included in the links. A link begins in the destination cell with = and then you pick up the variable from the variables page. If necessary, build a formula and add more variables. When complete, hit enter.
7. Check figures. Using Hi-Lo, the variable cost per unit is $1.17; Using Regression, the total fixed cost is $11,187.
6A. Least Squares Regression Analysis The management of Digger Inc., is trying to develop a cost formula for its major manufacturing overhead activities. Digger's manufacturing process is highly automated and power costs are a significant manufacturing cost. Cost analysts have decided that power costs are mixed. The costs must be separated into their fixed and variable components so that the cost behavior of the power usage activity can be better understood. Analysts have determined that machine hours drive power usage; thus, machine hours are the cost driver for power costs. Nine months of data have been collected and are presented in the chart below
Step by Step Solution
There are 3 Steps involved in it

Get step-by-step solutions from verified subject matter experts