

Question: 1. Logistic Regression: A model is being built to help predict optimal dosages of drugs. In the following figure, the image on the left
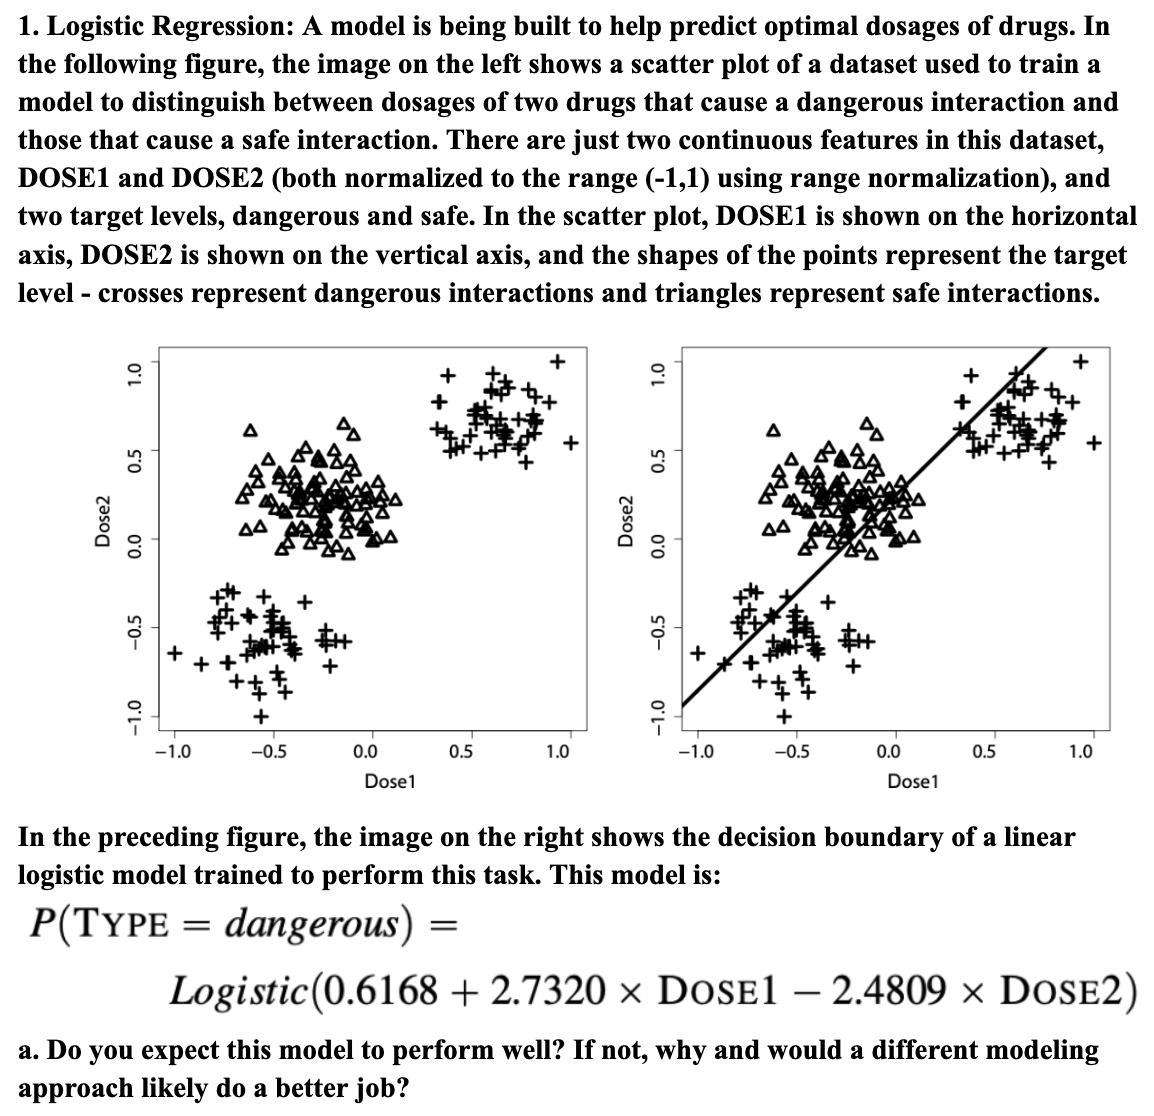
1. Logistic Regression: A model is being built to help predict optimal dosages of drugs. In the following figure, the image on the left shows a scatter plot of a dataset used to train a model to distinguish between dosages of two drugs that cause a dangerous interaction and those that cause a safe interaction. There are just two continuous features in this dataset, DOSE1 and DOSE2 (both normalized to the range (-1,1) using range normalization), and two target levels, dangerous and safe. In the scatter plot, DOSE1 is shown on the horizontal axis, DOSE2 is shown on the vertical axis, and the shapes of the points represent the target level - crosses represent dangerous interactions and triangles represent safe interactions. Dose2 1.0 0.5 0.0 -0.5 -1.0 -1.0 -0.5 = 0.0 Dose1 0.5 1.0 = Dose2 1.0 0.5 0.0 -0.5 -1.0 -1.0 -0.5 0.0 Dose1 0.5 In the preceding figure, the image on the right shows the decision boundary of a linear logistic model trained to perform this task. T model is: P(TYPE dangerous) 1.0 Logistic (0.6168 +2.7320 x DOSE1 -2.4809 x DOSE2) a. Do you expect this model to perform well? If not, why and would a different modeling approach likely do a better job?
Step by Step Solution
3.52 Rating (162 Votes )
There are 3 Steps involved in it
Without knowing more about the dataset and the issue at hand it is difficult to choose the right mod... View full answer

Get step-by-step solutions from verified subject matter experts