

Question: 1. Make a labeled scatterplot of your predictor and response variables to ensure they are appropriate for developing a linear model. 2. Make a histogram
1. Make a labeled scatterplot of your predictor and response variables to ensure they are appropriate for developing a linear model.
2. Make a histogram for the first variable. Be sure to include appropriate labels.
3. Make a histogram for the second variable. Be sure to include appropriate labels.
4. Make a table to show the summary statistics (mean, median, standard deviation) for both variables.]
5. Make a scatterplot of the variables with a line of best fit and the regression equation.
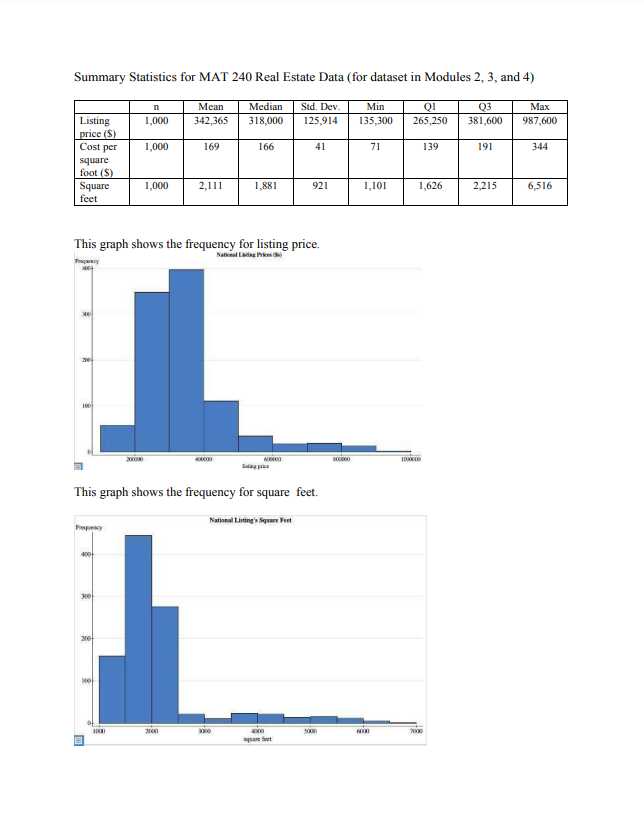
Summary Statistics for MAT 240 Real Estate Data ( for dataset in Modules 2, 3, and 4) n Mean Median Sid. Dev. Min 01 03 Listing Max 1,000 342,365 318,000 125,914 135,300 265,250 price ($) 381,600 987,600 Cost per 1,000 169 166 41 71 139 square 191 344 foot (S Square 1,000 2,111 1,881 921 1,101 feet 1,626 2,215 6,516 This graph shows the frequency for listing price. Natheal Living Pokeshe This graph shows the frequency for square feet. National Listing's Square Feet HO HO 1000
Step by Step Solution
There are 3 Steps involved in it

Get step-by-step solutions from verified subject matter experts