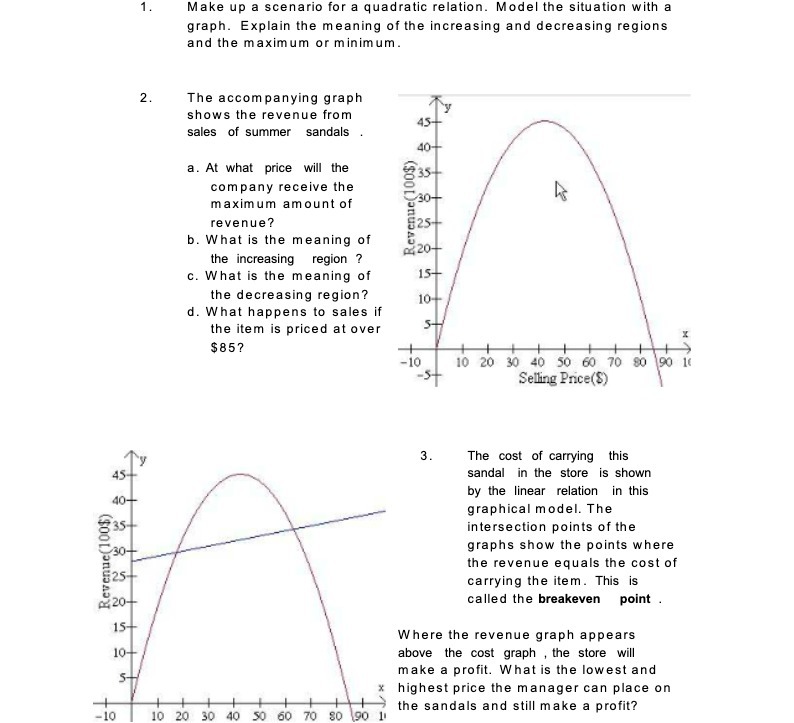
Question: 1. Make up a scenario for a quadratic relation. Model the situation with a graph. Explain the meaning of the increasing and decreasing regions and

1. Make up a scenario for a quadratic relation.
1. Make up a scenario for a quadratic relation. Model the situation with a graph. Explain the meaning of the increasing and decreasing regions and the maximum or minimum. 2. The accompanying graph shows the revenue from 45- sales of summer sandals 40- a. At what price will the 835 company receive the maximum amount of 30- revenue? Revenue b. What is the meaning of 20- the increasing region ? c. What is the meaning of 15- the decreasing region? 10- d. What happens to sales if the item is priced at over $85? 10 10 20 30 40 50 60 70 80 90 10 -5- Selling Price(S) 3. The cost of carrying this 45- sandal in the store is shown by the linear relation in this graphical model. The intersection points of the graphs show the points where Revenue(100$) the revenue equals the cost of carrying the item. This is called the breakeven point . 15- Where the revenue graph appears 10- above the cost graph , the store will S- make a profit. What is the lowest and highest price the manager can place on 40 50 the sandals and still make a profit? 10 10 20 30 60 70 80

Step by Step Solution

There are 3 Steps involved in it

1 Expert Approved Answer
Step: 1 Unlock blur-text-image
Question Has Been Solved by an Expert!

Get step-by-step solutions from verified subject matter experts

Step: 2 Unlock
Step: 3 Unlock

Students Have Also Explored These Related Mathematics Questions!